ABSTRACT

Purpose: To measure the amount of light energy that dental students actually deliver to a Class I preparation in a dental mannequin.
Materials and Methods: Approval for the study was obtained from the Dalhousie University Health Sciences Research Ethics Board. Each of 20 third-year dental students light-cured a Class I preparation in tooth 27 in a mannequin head. A photo detector located at the bottom of the cavity preparation measured how much light would be received by a restoration. Each student cured the simulated restoration for 20 seconds using a quartz–tungsten–halogen curing light (Optilux 401). The irradiance received (mW/cm2) was recorded in real time, and the energy per unit area (J/cm2) delivered to the detector by each student was calculated. The students were then given detailed instructions on how to effectively use the curing light, and the experiment was repeated.
Results: When the curing light was fixed directly over the tooth, the greatest amount of light energy delivered to the detector in 20 seconds was 13.9 ± 0.4 J/cm2. Before instruction, the students delivered between 2.0 and 12.0 J/cm2 (mean ± standard deviation [SD]: 7.9 ± 2.7 J/cm2). After receiving detailed instructions, the same students delivered between 7.7 and 13.4 J/cm2 (mean ± SD: 10.0 ± 1.4 J/cm2). A paired student’s test showed that instruction resulted in a significant improvement (p < 0.001).
Conclusions: Although instruction yielded improvements, the mean energy delivered was much less (7.9 J/cm2 before instruction and 10.0 J/cm2 after instruction) than the expected 13.9 J/cm2. To maximize the energy delivered, the operator should wear eye protection, should watch what he or she is doing and should hold the light both close to and perpendicular to the restoration.
Introduction
Clinicians face a number of challenges when they use light to cure a restoration. The intraoral space is relatively small and inaccessible, which may prevent a good view of the restoration. There are also several hard-to-reach areas, such as the distal aspect of the maxillary molars and the lingual aspect of the mandibular incisors, and it can be difficult to position the light guide close to and perpendicular to these surfaces. Thus, one can reasonably assume that the amount of light delivered to a restoration under ideal laboratory conditions could be quite different from what is actually delivered in the clinical setting.
Most research studies that have measured the output from dental curing lights have done so under ideal conditions, with the end of the light fixed as close as possible to the light meter. The ability of lights to cure resin composites is also usually tested with the curing light fixed directly over and perpendicular to the specimen. From this type of laboratory research, it is generally recommended that a 2-mm thick specimen of dental resin should receive between 12 and 24 J/cm2 of energy per unit area (also called energy density) for adequate polymerization.1-5 Yap and Seneviratne4 reported that 12 J/cm2 was enough energy to adequately polymerize a 2-mm thick increment of Filtek Z100 composite (3M ESPE,St. Paul, MN). Fan and colleagues5 reported that 6 to 12 J/cm2 was sufficient to cure most resin composites to a depth of 1.5 mm, but some composites required more than 18 J/cm2 to achieve an acceptable depth of curing of 1.5 mm. Despite these data, it has been reported that some resin composites may benefit from receiving as much as 36 J/cm2, depending on the brand and shade.6
Resin manufacturers rarely specify how much energy is required to adequately cure their products, but it is sometimes possible to calculate the required energy per unit area from the product of the values for recommended curing times (seconds) and recommended minimum irradiance (mW/cm2).7,8 When the amount of light energy received by the resin is inadequate, the resin will be inadequately polymerized. This is undesirable, because both the physical and the chemical properties of the restoration will be compromised.9-18 In addition, the biocompatibility of the resin restoration is adversely affected by undercuring.19-23 Hardness testing is a reliable and commonly used method to test how well a resin has been cured. The Knoop microhardness test is one of the best methods for testing the hardness of resin composites, and a good correlation has been reported between degree of conversion of the resin and the Knoop microhardness value.18,24
The purpose of this study was to determine how much energy (J/cm2) third-year dental students actually delivered to a Class I preparation in a mannequin head. The first hypothesis was that the energy delivered would be greater than 10 J/cm2. The second hypothesis was that the students would deliver more energy after receiving additional instructions on how to effectively use the curing light.
Materials and Methods
Appropriate approval from the Dalhousie University Health Sciences Research Ethics Board was obtained for this study. The Ethics Board required that all of the participants remain anonymous.
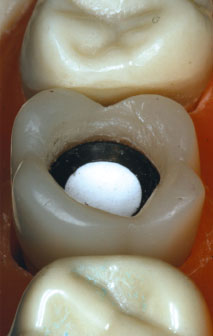
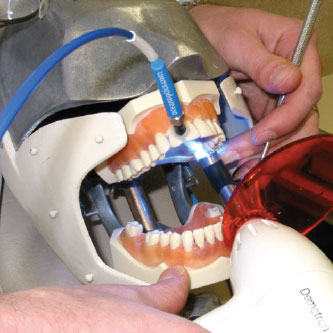
The irradiance and energy per unit area delivered to a 6.2-mm diameter Class I preparation in tooth 27 was measured using a photo detector (CC3-UV, Ocean Optics, Dunedin, FL) located at the bottom of the cavity preparation. The detector was 3.9 mm in diameter and was fixed 2 mm from the cavosurface margin and 4 mm from the cusp tip (Fig. 1a). As such, the light detector measured the irradiance (mW/cm2) that would be received by the top surface of a restoration that was 2 mm from the cavosurface margin and 4 mm from the end of the light guide. The detector was attached by a fibre optic cable to a spectrora diometer (USB 4000, Ocean Optics). To simulate the optical characteristics of a human tooth, the maxillary molar tooth holding the detector was made from Vit-l-escence shade A2 dental composite (Ultradent, South Jordan, UT). Before use, the light detector was calibrated using a light source (LS-1-CAL, Ocean Optics) with calibration traceable through the National Institute of Standards and Technology (Gaithersburg, MD). To simulate a clinical setting, the tooth containing the light detector was placed in a dental typodont, and the mannequin head was attached to a dental chair (Fig.1b).
 |
 |
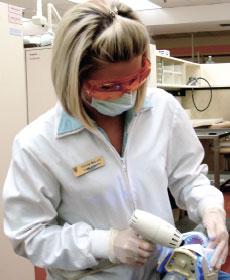 |
Figure 1a: Detector positioned in tooth 27, simulating the position of resin 2 mm from the cavosurface margin. |
Figure 1b: Curing light delivering light to the tooth in a mannequin head attached to a dental chair. |
Figure 2: One of the authors demonstrating proper light-curing technique. She is looking at the preparation, wearing eye protection, stabilizing the light with her hand and paying attention. |
Twenty third-year dental students, who had all used the same dental curing light in both instructional and clinical settings, volunteered to participate in the study. Each student was identified by a unique number from 1 to 20. The students were instructed to adjust the chair and mannequin head as if a patient was sitting in the chair and then to cure the simulated restoration in the Class I preparation exactly as they would for their patients. They all used the same quartz–tungsten–halogen (QTH) light with a 10-mm standard light guide (Optilux 401, Kerr Corporation, Orange, CA), and the light output from the unit was monitored for consistency throughout the study. To simulate curing Filtek Supreme resin (3M ESPE), the students followed the manufacturer’s instructions25 and light-cured the simulated restoration for 20 seconds. The irradiance (mW/cm2) received by the detector was measured in real time, and the energy delivered (J/cm2) was calculated.
In a pilot project, it had been noted that those students who delivered a low irradiance and a low amount of energy to the tooth did not wear the orange protective eyeglasses that were available, did not look at the preparation, did not stabilize the curing light with one hand or did not pay attention to what they were doing. Therefore, these principles were used in teaching each student how to optimize delivery of light to a dental restoration. The students were specifically instructed to wear eye protection, to look at the preparation, to stabilize the light as close as possible to the restoration and to pay attention (Fig. 2). The students then repeated the experiment. Because of software limitations, neither the researcher nor the students knew how much energy had been delivered before instruction and thus both were blinded as to the amount of energy delivered. Instead, the energy delivered by each student before and after instruction was calculated after the experiment was complete. The results were then subjected to analysis of variance, followed by a paired student’s t test (α = 0.05).
The manufacturer of Filtek Supreme resin does not state how much energy is required to adequately cure this composite;25 it was therefore necessary to determine a minimum acceptable energy dose for this composite. A bottom–top surface hardness ratio of 80% has been suggested to be clinically acceptable when a resin composite has been cured.26 To determine how much energy was necessary to adequately cure a 2-mm thick specimen of Filtek Supreme resin composite, shade A2B, different amounts of energy were delivered from a QTH curing light to test specimens of this composite. To prepare each specimen, a metal ring (2 mm thick, with internal diameter 6 mm) was placed on a Mylar polyester strip (DuPont Co., Wilmington, DE), filled with Filtek Supreme A2B composite and then covered with another Mylar polyester strip. A glass slide was pressed down over the specimen to produce a smooth, flat surface. To provide a clinically relevant reflective background surface, the specimen was cured over a flat rectangular slab of shade A2 resin composite (Vit-l-essence, Ultradent).26,27 The QTH light was left on for various periods of time, such that the composite specimens were cured with 10 different amounts of energy, from 2 to 20 J/cm2. Three specimens were light-cured at each energy level, in random order. The samples were stored in air for 24 hours in the dark at room temperature to allow for post-curing.The Mylar polyester strips were then removed, and the Knoop microhardness at the top and bottom surfaces of the specimens was measured using an automated hardness-testing machine (model HM 123, Mitutoyo Canada Inc., Mississauga, ON) and a 50-g indenter load. The hardness tester was preprogrammed to measure 9 Knoop hardness values over the surface of the specimen in a matrix pattern, ensuring at least a 1-mm buffer area of composite around the edge of the specimen. This buffer minimized inclusion of data for areas where the mould might have affected resin polymerization.28 The amount of energy required for the bottom surface of the 2-mm thick disks to reach 80% of the maximum Knoop microhardness reached at the top surface was calculated.26
To determine the theoretical maximum amount of energy that could be delivered to the 3.9 mm diameter light detector in 20 seconds, the end of the light guide was positioned in contact with the cusp tip. The light guide was positioned directly over and perpendicular to the detector, which was at a distance of 4 mm from the end of the light guide. The curing light was clamped in place over the tooth, and the greatest amount of light energy delivered to the detector in 20 seconds was measured. The typodont and curing light were then repositioned. The energy measurements were repeated 3 times, and the mean maximum energy (J/cm2) that was delivered to the top of the simulated restoration was calculated.
To investigate why some students still delivered a low irradiance after instruction, even though they held the curing light stationary, the effect of changing the angle of the light guide relative to the tooth was examined under laboratory conditions. The irradiance received by the detector in the tooth was measured with the end of the light guide at angles of 0°, 15°, 30°, 45° and 60° relative to the end of the light detector. The same QTH light (Optilux 401) was applied for 20 seconds, and the energy delivered to the detector was measured 3 times at each angle.
Results
Table 1 Effect of delivering different amounts of energy
(J/cm2) on Knoop hardness (KHN) at top and bottom of 2-mm thick
specimens of Filtek Supreme A2B resin composite
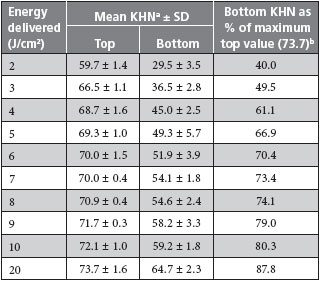
aMean ± standard deviation (SD) of 3 repetitions, with 9 recordings on each surface (i.e., n = 27 KHN recordings at each surface and each energy level).
bThis column presents the mean KHN at the bottom of the specimen as a percentage of the maximum hardness achieved at the top of the specimen (i.e., 73.7, after delivery of 20 J/cm2). At least 10 J/cm2 was required for the bottom surface to reach 80% of the maximum hardness achieved at the top.
For specimens of Filtek Supreme resin composite, shade A2B, at least 10 J/cm2 of energy was required for the bottom surface to reach 80% of the maximum hardness reached at the top (Table 1). Under controlled laboratory conditions, when the tooth and typodont were fully accessible on the laboratory bench, a mean irradiance of 695 mW/cm2 was delivered to the detector, and the greatest amount of light energy that could be delivered in 20 seconds to the 3.9 mm diameter detector was 13.9 J/cm2 (± standard deviation [SD]: ± 0.4 J/cm2). Before the students received detailed instructions about using the curing light, the amount of energy that they were able to deliver ranged from 2.0 to 12.0 J/cm2 (mean ± SD: 7.9 ± 2.7 J/cm2) (Table 2a, Fig. 3). Fifteen (75%) of the students delivered less than 10 J/cm2 of energy. After the students received additional instruction on how to use the curing light, the amount of energy delivered increased to between 7.7 and 13.4 J/cm2 (mean ± SD:10.0 ± 1.4 J/cm2) (Table 2b, Fig. 4). There was a significant difference in the amount of energy the students delivered before and after instruction (ANOVA, p = 0.003) (Table 2b). More specifically, after receiving additional instruction, the students delivered 2.1 J/cm2 more energy (19 degrees of freedom, t = –4.949, student paired t test, p < 0.001). However, even after receiving this additional instruction, 50% of the students still could not deliver 10 J/cm2 of energy (Fig. 4).
In the laboratory environment, a change from 0° to 30° in the angulation of the light guide resulted in a 26% decrease in the amount of energy delivered to the detector, but using this light still allowed delivery of more than 10 J/cm2 in 20 seconds (Fig. 5). Beyond 30°, however, less than 10 J/cm2 of energy was delivered in 20 seconds.
Table 2a Comparison of energy delivered by students before and after additional instruction about light-curing
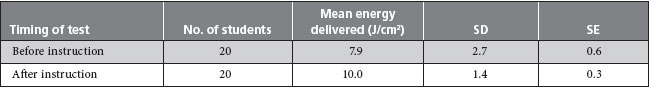
SD = standard deviation, SE = standard error.
Table 2b Results of analysis of variance (ANOVA) comparing energy delivered by students before and after further instruction about light-curing
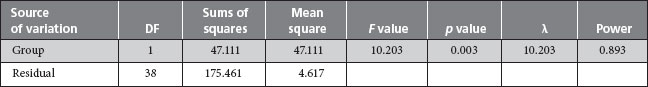
DF = degrees of freedom.
Discussion
In a dental clinic training setting, 20 third-year students cured a simulated Class I restoration in a maxillary molar tooth for 20 seconds with a QTH curing light. There was great variation in the amount of light delivered by individual students (Figs. 3 and 4). The average energy delivered to the Class I preparation before these students received additional instruction on how to use curing lights was 7.9 ± 2.7 J/cm2. None of the students was able to deliver the maximum energy of 13.9 J/cm2 that was achieved when the tooth with the detector was fully accessible on the laboratory bench. Even after further instruction, half of the students could not deliver 10 J/cm2 to the simulated restoration, and the first hypothesis was rejected.

Figure 3: Irradiance and energy delivered by individual students before they received additional instructions about using the curing light. The maximum energy delivered to the detector with 20 seconds of curing was 13.9 ± 0.4 J/cm2 (mean ± standard deviation) under optimum laboratory conditions; the mean energy delivered by the students was 7.9 ± 2.7 J/cm2.
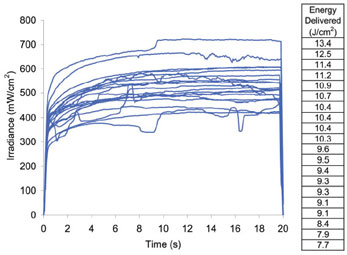
Figure 4: Irradiance and energy delivered by individual students after they received additional instructions about using the curing light. The mean energy delivered by the students was 10.0 ± 1.4 J/cm2.
After instruction, the performance of all students improved, and they delivered between 7.7 and 13.4 J/cm2 of energy (mean ± SD: 10.0 ± 1.4 J/cm2) (Fig. 4). This improvement was statistically significant (p < 0.001), and the mean amount of energy delivered rose from 57% to 72% of the potential maximum (13.9 J/cm2). Therefore, the second hypothesis of this study was accepted.
For this study, the minimum acceptable amount of energy to be delivered, based on information for Filtek Supreme resin composite shade A2B, was set at 10 J/cm2. As shown in Table 1, this number was not arbitrary; rather, it was the minimum amount of energy that had to be delivered for the bottom of a 2-mm thick specimen of this resin to reach 80% of the hardness achieved at the top after delivery of 20 J/cm2 of energy. It was considered unlikely that more than 20 J/cm2 would be delivered in dental practice, and there was only a small increase in the Knoop microhardness measured at the top surface (from 72.1 ± 1.0 to 73.7 ± 1.6) when the energy delivered was increased from 10 to 20 J/cm2. However, if further increases in the amount of energy delivered also lead to further increases in the hardness of the top surface, this would raise the minimum amount of energy required for the bottom to reach 80% of the hardness at the top. The value of 10 J/cm2 is also similar to the minimum energy level suggested by some manufacturers to adequately polymerize a 2-mm increment of their resin composites.7,8
As the study progressed, it was noted that some students had excellent curing technique, with one student delivering 96% (13.4 J/cm2) of the potential maximum amount of energy, but others had poor technique. The students’ technique was related to the amount of energy delivered, which ranged from 2.0 J/cm2 (the lowest value before instruction) to 13.4 J/cm2 (the highest value after instruction). As a general observation, it was common for the students to point the curing light at the tooth, press the “on” button, and then look away from the bright blue light. During the ensuing 20 seconds, the curing light tended to drift away from the simulated restoration, as shown in Fig. 3. In the most extreme example, the curing light shifted to a completely different tooth. This problem probably also occurs in the clinical setting, where light-curing is one of the last steps in creating a restoration, at which point the practitioner’s attention (or that of his or her assistant) may wander. After instruction that emphasized the need to use eye protection, to look at the preparation, to stabilize the light with one hand as close as possible to the restoration and to pay attention, the students’ technique became more consistent, and all students delivered more energy to the tooth. This improvement was exemplified by the reduction in the standard deviation from 2.7 J/cm2 before instruction to 1.4 J/cm2 after instruction.
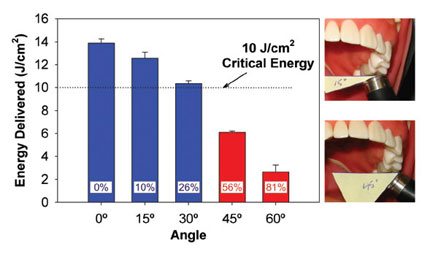
Figure 5: Effect of increasing the angle between the light guide and the detector on the energy delivered from the Optilux 401 curing light when applied for 20 seconds. The percent reduction in energy delivered is noted within each bar. Angles that did not allow delivery of the critical amount of energy (10 J/cm2 ) are indicated in red (45° and 60°).
The light detector used in this study (CC3-UV, Ocean Optics) had a Spectralon diffusing material designed to collect light over 180°. This eliminated the optical interface problems that are associated with the sampling geometry for light collection inherent to other devices. As such, the calibrated spectroradiometric measuring device used in this study provided an accurate record of how much light would be received on the top surface of a restoration that was 2 mm from the cavosurface margin and 4 mm from the end of the light guide. This was considered a clinically relevant position, but deeper preparations would receive less light. Although the same curing light was used throughout the study, there was wide variation in the students’ ability to deliver light to the restoration (Figs. 3 and 4). Before instruction, this variation was probably a result of the students not looking at what they were doing and allowing the light to move during the light-curing process. After additional instruction, there was less variation in the amount of light that each student delivered over 20 seconds, but still, half of the students did not deliver 10 J/cm2, probably because of errors in positioning the light guide over the tooth. Figure 5 illustrates the effect of not holding the end of the light guide perpendicular to the detector. As the angulations of the light guide increased, the irradiance received by the detector decreased, until at 30° only 10.3 ± 0.3 J/cm2 of energy was delivered. When the light guide was misaligned by more than 30°, the energy delivered fell below 10 J/cm2. This effect would be even greater for deeper preparations, where the tooth cusps produce more shadows and prevent the light from reaching the resin. This illustrates the importance of using proper technique and keeping the light guide perpendicular to the restoration.
This study transfers light-curing research from the laboratory to a clinical setting and has real-life implications. Using a dental mannequin attached to a dental chair was the only practical way to predict how much light energy restorations receive in the mouth. In the laboratory, Filtek Supreme resin composite shade A2B must receive at least 10 J/cm2 of energy from the Optilux 401 QTH curing light for the bottom surface to reach 80% of the hardness at the top (Table 1). The manufacturer’s curing instructions for this resin composite recommend 20 seconds of light curing.25 Although this duration of curing may be sufficient in the laboratory setting, many of the students delivered less than 10 J/cm2 to the simulated restoration in the mannequin head with 20 seconds of light-curing, even after receiving additional instruction. Delivery of insufficient energy has many undesirable consequences, including inadequate physical properties,9-12 reduced bond strengths,13-15 increased breakdown at the margins of the restoration with use,16-18 decreased biocompatibility19-21 and potentially increased DNA damage because of leachates.22 If the curing time had been doubled to 40 seconds with the same light unit, all students would have delivered 10 J/cm2 of energy. Alternatively, use of a more powerful curing light would have allowed delivery of sufficient energy, but this may cause an unacceptable rise in temperature to the tooth and surrounding tissues.29
In considering the critical minimum amount of energy required to adequately cure a resin composite, it is important to remember that the amount of energy required depends on the product used, the type of curing light and the type of light guide.9,30-36 Some brands of resin composite may require more or less than 10 J/cm2 of energy for adequate curing. In addition, QTH lights are broad-spectrum lights, whereas the various generations of light-emitting diode curing lights deliver markedly different light spectra.34 These differences will affect the critical minimum amount of energy needed to adequately cure the resin.35,36 In addition, since the performance of a curing light is greatly affected by the design of the light guide, the results achieved in a research study are specific to the curing light and light guide used. 30,31,37 For example, in the present study the detector was 4 mm away from the end of the light guide. At 6 mm from the end of the light guide, the irradiance received from a standard light guide has been reported to fall to 50% of its original value. When a turbo light guide was used on the same curing light at 6 mm, the irradiance fell to 23% of its original value.31
In this study, third-year dental students used a single QTH curing light with a standard light guide. Future studies are planned to determine how much light energy practising dentists are able to deliver; the effects of using different types of curing lights, different curing times and light guides of different designs; and the amount of energy received at different locations in the mouth.
Conclusions
There was a large range (between 2.0 and 12.0 J/cm2) in the amount of light energy that third-year dental students delivered to the top surface of a Class I restoration positioned 4 mm from the end of the light guide in tooth 27, using the QTH (Optilux 401) light for 20 seconds. Fully three-quarters of the students delivered less than 10 J/cm2 when they performed the light-curing with the instruction typically received by third-year dental students at Dalhousie University.
After the students received additional instruction about light-curing, the amount of energy delivered increased significantly, from 7.9 ± 2.7 J/cm2 to 10.0 ± 1.4 J/cm2 (p < 0.01), with the students using the same light-curing unit for the same duration. In addition, after instruction, half of the students delivered more than 10 J/cm2.
THE AUTHORS
|
|
Dr. Price is a professor in the department of dental
clinical sciences, Dalhousie University, Halifax, Nova Scotia. |
|
|
Dr. McLeod was a fourth-year dental student at Dalhousie University when the study was conducted. She is now in private practice in St. John's, Newfoundland. |
|
|
Mr. Felix is a research assistant in the department of dental clinical sciences, Dalhousie University, Halifax, Nova Scotia. |
Acknowledgements: This project was supported by Dalhousie University, NSERC Discovery Grant #298326 and the CIHR NORTH summer student program.
Correspondence to: Dr. Richard Price, Department of dental clinical sciences, Room 5168, 5981 University Avenue, Faculty of dentistry, Dalhousie University, Halifax, NS B3H 1W2. Email: rbprice@dal.ca
The authors have no declared financial interests in any company manufacturing the types of products mentioned in this article.
This article has been peer reviewed.
References
- Calheiros FC, Daronch M, Rueggeberg FA, Braga RR. Degree of conversion and mechanical properties of a BisGMA:TEGDMA composite as a function of the applied radiant exposure. J Biomed Mater Res B Appl Biomater. 2008;84(2):503-9.
- Lovell LG, Newman SM, Donaldson MM, Bowman CN. The effect of light intensity on double bond conversion and flexural strength of a model, unfilled dental resin. Dent Mater. 2003;19(6):458-65.
- Lee SY, Greener EH. Effect of excitation energy on dentine bond strength and composite properties. J Dent. 1994;22(3):175-81.
- Yap AU, Seneviratne C. Influence of light energy density on effectiveness of composite cure. Oper Dent. 2001;26(5):460-6.
- Fan PL, Schumacher RM, Azzolin K, Geary R, Eichmiller FC. Curing-light intensity and depth of cure of resin-based composites tested according to international standards. J Am Dent Assoc. 2002;133(4):429-34.
- Calheiros FC, Kawano Y, Stansbury JW, Braga RR. Influence of radiant exposure on contraction stress, degree of conversion and mechanical properties of resin composites. Dent Mater. 2006;22(9):799-803. Epub 2006 Jan 19.
- Tetric EvoCeram: Instructions for use. Ivoclar Vivadent AG, Schaan/ Liechtenstein; 2008.
- Ælite LS Posterior instructions for use. BISCO Inc., Schaumburg, ILL; 2008.
- Caldas DB, de Almeida JB, Correr-Sobrinho L, Sinhoreti MA, Consani S. Influence of curing tip distance on resin composite Knoop hardness number, using three different light curing units. Oper Dent. 2003;28(3):315-20.
- Correr AB, Sinhoreti MA, Sobrinho LC, Tango RN, Schneider LF, Consani S. Effect of the increase of energy density on Knoop hardness of dental composites light-cured by conventional QTH, LED and xenon plasma arc. Braz Dent J. 2005;16(3):218-24. Epub 2006 Jan 12.
- Harris JS, Jacobsen PH, O’Doherty DM. The effect of curing light intensity and test temperature on the dynamic mechanical properties of two polymer composites. J Oral Rehabil. 1999;26(8):635-9.
- Lohbauer U, Rahiotis C, Krãmer N, Petschelt A, Eliades G. The effect of different light-curing units on fatigue behavior and degree of conversion of a resin composite. Dent Mater. 2005;21(7):608-15.
- Xu X, Sandras DA, Burgess JO. Shear bond strength with increasing lightguide distance from dentin. J Esthet Restor Dent. 2006;18(1):19-27.
- Kim SY, Lee IB, Cho BH, Son HH, Um CM. Curing effectiveness of a light emitting diode on dentin bonding agents. J Biomed Mater Res B Appl Biomater. 2006;77(1):164-70.
- Staudt CB, Krejci I, Mavropoulos A. Bracket bond strength dependence on light power density. J Dent. 2006;34(7):498-502. Epub 2006 Jan 18.
- Ferracane JL, Mitchem JC, Condon JR, Todd R. Wear and marginal breakdown of composites with various degrees of cure. J Dent Res. 1997;76(8):1508-16.
- St-Georges AJ, Swift EJ Jr, Thompson JY, Heymann HO. Curing light intensity effects on wear resistance of two resin composites. Oper Dent. 2002;27(4):410-7.
- Vandewalle KS, Ferracane JL, Hilton TJ, Erickson RL, Sakaguchi RL. Effect of energy density on properties and marginal integrity of posterior resin composite restorations. Dent Mater. 2004;20(1):96-106.
- Moin Jan C, Nomura Y, Urabe H, Okazaki M, Shintani H. The relationship between leachability of polymerization initiator and degree of conversion of visible light-cured resin. J Biomed Mater Res. 2001;58(1):42-6.
- de Souza Costa CA, Hebling J, Hanks CT. Effects of light-curing time on the cytotoxicity of a restorative resin composite applied to an immortalized odontoblast-cell line. Oper Dent. 2003;28(4):365-70.
- Franz A, König F, Anglmayer M, Rausch-Fan X, Gille G, Rausch WD, et al. Cytotoxic effects of packable and nonpackable dental composites. Dent Mater. 2003;19(5):382-92.
- Knezevic A, Zeljezic D, Kopjar N, Tarle Z. Cytotoxicity of composite materials polymerized with LED curing units. Oper Dent. 2008;33(1):23-30.
- Jontell M, Hanks CT, Bratel J, Bergenholtz G. Effects of unpolymerized resin components on the function of accessory cells derived from the rat incisor pulp. J Dent Res. 1995;74(5):1162-7.
- Rueggeberg FA, Craig RG. Correlation of parameters used to estimate monomer conversion in a light-cured composite. J Dent Res. 1988;67(6):932-7.
- Filtek Supreme Plus instructions. 3M Center Dental, St. Paul, MN; 2005.
- Schattenberg A, Lichtenberg D, Stender E, Willershausen B, Ernst CP. Minimal exposure time of different LED-curing devices. Dent Mater. 2008;24(8):1043-9. Epub 2008 Jan 31.
- El-Mowafy O, El-Badrawy W, Lewis DW, Shokati B, Soliman O, Kermalli J, et al. Efficacy of halogen photopolymerization units in private dental offices in Toronto. J Can Dent Assoc. 2005;71(8):587. Available: www.cda-adc.ca/jcda/vol-71/issue-8/587.html.
- Vandewalle KS, Roberts HW, Rueggeberg FA. Power distribution across the face of different light guides and its effect on composite surface microhardness. J Esthet Restor Dent. 2008;20(2):108-17.
- Bagis B, Bagis Y, Ertas E, Ustaomer S. Comparison of the heat generation of light curing units. J Contemp Dent Pract. 2008;9(2):65-72.
- Price RB, Derand T, Sedarous M, Andreou P, Loney RW. Effect of distance on the power density from two light guides. J Esthet Dent. 2000;12(6):320-7.
- Felix CA, Price RB. The effect of distance from light source on light intensity from curing lights. J Adhes Dent. 2003;5(4):283-91.
- Shortall AC, Harrington E. Relative merits of narrow versus standard diameter light guides. Eur J Prosthodont Restor Dent. 2001;9(1):19-23.
- Prati C, Chersoni S, Montebugnoli L, Montanari G. Effect of air, dentin and resin-based composite thickness on light intensity reduction. Am J Dent. 1999;12(5):231-4.
- Price RB, Felix CA, Andreou P. Third-generation vs a second-generation LED curing light: effect on Knoop microhardness. Compend Contin Educ Dent. 2006;27(9):490-6.
- Price RB, Felix CA. Effect of delivering light in specific narrow bandwidths from 394 to 515nm on the micro-hardness of resin composites. Dent Mater. 2009;25(7):899-908. Epub 2009 Feb 24.
- Nomoto R. Effect of light wavelength on polymerization of light-cured resins. Dent Mater J. 1997;16(1):60-73.
- Nitta K. Effect of light guide tip diameter of LED-light curing unit on polymerization of light-cured composites. Dent Mater. 2005;21(3):217-23.