This video demonstrates how MARC can be used to accurately measure how much light energy is delivered to a restoration from a dental curing light.

ABSTRACT
Purpose: To determine the effect of operator, curing light and preparation location, as well as any correlations among these variables, on the amount of light energy delivered to simulated cavity preparations.
Materials and Methods: Each of 10 dentists and 10 fourth-year dental students light-cured a Class I preparation in tooth 26 and a Class V preparation in tooth 37 in a dental mannequin head. The operators exposed each preparation for 10 seconds with each of 3 LED-based curing lights (Bluephase G2 on high power, Demi and VALO on standard power). Each operator also used the VALO unit in the plasma mode for 2 sequential 3-second curing cycles. For each combination of operator, curing light and preparation, the irradiance (mW/cm2) received at the base of the preparation was measured with a laboratory-grade spectroradiometer, and software was used to calculate the energy density delivered in real time. The statistical analysis included 3-way analysis of variance (ANOVA) and the Fisher protected least significant difference (PLSD) test for post hoc pairwise comparisons.
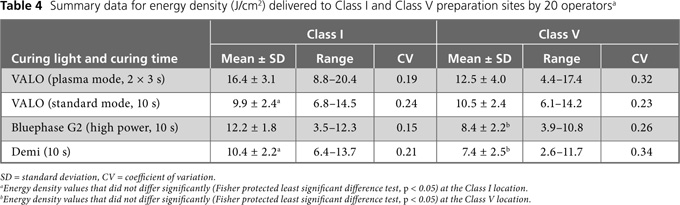
Results: There was a large qualitative and quantitative variation in the irradiance delivered to the preparations by each operator. Three-way ANOVA showed no statistically significant differences between dentists and dental students in terms of the amount of energy delivered (p = 0.90). However, there were statistically significant differences in energy delivered by the various curing lights (p < 0.001) and between the 2 preparation locations (p < 0.001). According to the Fisher PLSD test for post hoc pairwise comparison of means, the VALO unit used in the plasma mode for two 3-second curing cycles delivered the most energy (16.4 ± 3.1 J/cm2) to the Class I preparation, and the same light used for 10 seconds in the standard mode delivered the least amount of energy (9.9 ± 2.4 J/cm2) (p < 0.001). For the Class V preparation, the VALO unit used in the plasma mode for two 3-second curing cycles delivered the most energy (12.5 ± 4.0 J/cm2), and the Demi unit, used for 10 seconds, delivered the least energy (7.4 ± 2.5 J/cm2).
Conclusions: The energy delivered by a curing light to a preparation in a simulated clinical environment was affected by the operator's light-delivery technique, the choice of curing light and the location of the preparation.
Introduction
The success of resin restorations depends on many factors, including the technical difficulty of the procedure, the degree of moisture control, the effects of shrinkage during polymerization, the type of resin, the porosity of the resin and how well the resin is cured. Four variables affect the extent to which a resin is polymerized (cured) within the tooth: operator technique, choice of curing light, location of the restoration and type of resin used. A recently developed device called Managing Accurate Resin Curing (MARC; BlueLight analytics inc., Halifax, NS) takes all 4 of these variables into account, measuring both the irradiance and the energy received by a simulated preparation in a mannequin head.1
The irradiance values for commercially available curing lights range from 300 to 4000 mW/cm2, but it is not the irradiance that determines how well a resin is cured. Instead, adequate polymerization of composite resins correlates strongly with the irradiant energy delivered to the restoration. The energy density (J/cm2) received by the resin is the mathematical product of irradiance (mW/cm2) and exposure time. Thus, after a 10-second exposure, a commercial curing light delivering 1000 mW/cm2 would deliver an energy density of 10 J/cm2. Resin manufacturers provide minimum curing times and irradiance levels and thus define the minimum energy requirements for their resins. Depending on the brand and shade, these have been reported to range from 6 to 24 J/cm2 for a 2-mm increment of dental resin.1-7 Because of wide variation in the irradiance of curing lights and the differing energy requirements of resins, the required exposure times vary widely. In addition, the light intensity of the majority of curing units decreases over clinically relevant distances; therefore, as the distance to the resin increases, longer exposure times may be needed to deliver the required energy to the restoration.8-11 This reduction in irradiance with increasing tip distance varies widely among brands of curing units, and the choice of light guide confounds the issue.11-17 For example, for one light curing unit, researchers reported a 50% reduction in light intensity as the distance increased from 0 mm to 6 mm with use of a standard light guide. However, with use of a turbo light guide in the same light curing unit, the reduction in irradiance over the same distance (0 to 6 mm) was 77%.14 This finding is clinically relevant for Class II restorations, for which the distance from the end of the light guide to the gingival floor of a proximal box can easily be 6 mm or more.
Studies establishing the relationship between energy density received and qualities of the resultant resin curing have typically utilized ideal laboratory conditions, whereby the light curing unit was fixed at 90° directly above the resin, maximizing exposure of the restoration to the beam and minimizing the amount of light scattering at the surface.3,5-11,13 However, in a clinical environment, there are substantial deviations from this ideal configuration, and the clinician may have difficulty achieving or consistently maintaining the orientation of the light guide end at 90° with respect to the restoration. Under these clinical conditions, it is unlikely that experimentally determined exposure times will deliver the intended total dose of light energy. Furthermore, operator error may cause the curing light to shift in position relative to the restoration. This could reduce the actual time that the resin is exposed to the light and the energy delivered to the restoration.
Many studies of the effects of different light curing units on resin polymerization have used hand-held dental curing radiometers to measure irradiance,18-21 but other work has shown that these instruments are inaccurate.22,23 In addition, these meters report only the irradiance at the tip-end of the curing light; they do not report the irradiance or energy actually received by the resin restoration. Consequently, dentists have no way of knowing how much energy they are delivering to restorations. Instead, practitioners must rely on manufacturers' "recommended curing times," which are further qualified according to shade of the resin, thickness of the increment, distance from light source to the resin and light output. The implications of these factors may not always be fully understood.
Undercuring the resin adversely affects its physical properties,10,21,24-29 reduces bond strength,10,21,27 increases marginal wear and breakdown,28,29 decreases biocompatibility,30-35 potentially increases DNA damage resulting from leachates32 and increases bacterial colonization of the resin.35 Equally undesirable is the delivery of too much energy to the tooth, which may cause thermal damage to the pulp and exposed oral tissues.36-42 Therefore, it is essential to establish a method for accurately quantifying the energy delivered by a curing light to a dental restoration under clinically relevant conditions. It would then be possible to determine the effects of operator technique, choice of curing light and position of the restoration on the amount of energy that the resin actually receives.
The study reported here provides data to bridge the gap between measurements obtained under ideal laboratory conditions and the clinical situation. The study was undertaken to test 3 research hypotheses. First, given that dental training is highly consistent, it was postulated that there would be no difference between dentists and fourth-year dental students in the ability to deliver a specified amount of energy density. Second, it was hypothesized that the energy density delivered by each curing light would be the same for all operators. Finally, it was assumed that there would be no difference in the energy delivered to Class I and Class V preparations with exposure to the same curing light for the same time.
Materials and Methods
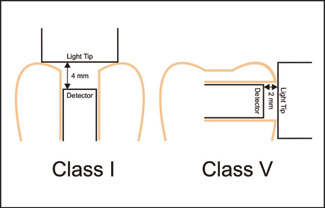 Figure 1: Schematics of the location of the light detectors placed in simulated Class I and Class V preparation sites. The teeth were placed inside a mannequin simulation head.
Approval for the study was obtained from the Dalhousie University Health Sciences Research Ethics Board. The Research Ethics Board required that all the participants remain anonymous.
The MARC device for measuring both irradiance and energy received at the preparation site was constructed by fixing a 3.9-mm diameter cosine corrected irradiance probe (CC3-UV, Ocean Optics, Dunedin, FL) at the bottom of 2 different types of cavity preparations (Fig. 1) within a dentoform (NIS-SIM simulation head, Kilgore, Coldwater, MI) attached to a dental chair. The teeth were fixed to the dentoform with epoxy resin. For the Class I preparation, the detector was fixed inside tooth 26, with epoxy resin 2 mm deep from the occlusal surface and 4 mm from the cusp tips. For the Class V preparation, the detector was fixed 2 mm from the buccal surface of tooth 37. A laboratory-grade spectroradiometer (USB 4000, Ocean Optics) was attached to the probes using a bifurcated fibre optic cable (Avantes, Broomfield, CO) to determine the light irradiance (mW/cm2) delivered from the commercial curing lights during simulated photo-curing of the resin at the floor of the preparation. Before use, the equipment was calibrated for both frequency and irradiance using a light source (LS-1-CAL, Ocean Optics) with a National Institute of Standards and Technology (NIST; Gaithersburg, MD) traceable light source. The equipment was zeroed to the ambient light before each recording, and the absolute error in calibrating the spectroradiometer was ± 5%. The mouth opening was fixed at 43 mm, as measured at the incisors.43
Twenty operators (10 dentists and 10 fourth-year dental students) were instructed to position the head of the mannequin as they would position a patient's head and then to perform simulated light-curing for 10 seconds on each of the 2 preparations with a variety of commercially available blue LED-type curing lights: the VALO unit (Ultradent Products, South Jordan, UT) used in the standard mode, the Bluephase G2 unit (Ivoclar Vivadent, Amherst, NY) used at high power and the Demi unit (Kerr Corp., Orange, CA). Participants also used the VALO unit in the plasma mode for two 3-second curing cycles.
For each simulated curing exposure, custom software (24/7, Halifax, NS) recorded the irradiance delivered to the preparation site in real time. The software calculated the resulting real-time energy density delivered to the 3.9-mm diameter detector as the product of irradiance and time. Three-way analysis of variance (ANOVA) was used to evaluate the effect of operator, choice of curing light and location of the preparation on the amount of energy received at each preparation site. The Fisher protected least significant difference (PLSD) test for post hoc comparisons was used to examine pairwise differences in the energy density delivered by the curing units. All statistical testing was performed at a preset alpha of 0.05.
Results
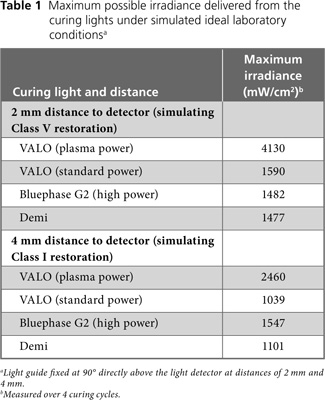
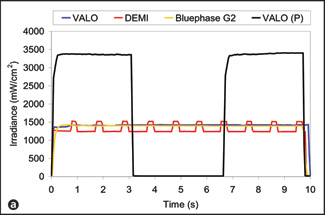
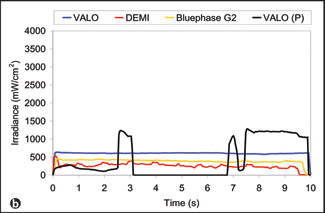
The maximum possible irradiance delivered by the curing lights over 4 curing cycles under ideal laboratory conditions, with the light guide fixed directly above and at an angle of 90° with respect to the light detector, at distances of 4 mm (representing a Class I restoration) and 2 mm (representing a Class V restoration), varied by a factor of more than 2 (Table 1). In the clinical situation, the distance and angle are less easily controlled, and they change with any movements of the operator and the patient. Figs. 2 and 3 illustrate real-time delivery of irradiance to the simulated Class I and Class V preparations by 2 operators using the same curing lights: one operator delivering consistent, high levels of energy (part a in each figure) and the other delivering consistently less energy (part b in each figure). Because of differences in the operators' clinical technique, there were clear differences in the irradiance delivered during the exposures. A comparison of Table 1 with Figs. 2 and 3 indicates that the operators did not achieve the maximum possible irradiance. Furthermore, Figs. 2 and 3 show the great real-time variation in irradiance delivered by the best operator (part a in each figure) and the worst operator (part b in each figure).
 |
 |
|
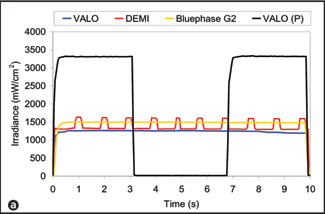
Figure 2: Plot of irradiance vs. time for the individual operators delivering the highest irradiance (a) and the lowest irradiance (b) during simulated curing of the Class I preparation. There was substantial real-time variation in the irradiance delivered by these 2 operators. Both the Bluephase G2 unit and the VALO unit in standard mode deliver continuous output. The VALO unit in plasma mode, designated in the figure as "VALO (P)," delivers light for 3 seconds and then shuts off. For this mode, each operator was instructed to leave the unit off for about 3 seconds before initiating another 3-second curing cycle. For display purposes only, the pause time on the VALO unit in plasma mode was adjusted to fit with the 10-second overall curing time on these charts. The Demi curing light delivers light pulses every second. |
|
 |
 |
|
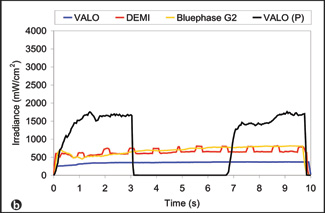
Figure 3: Plot of irradiance vs. time for the individual operators delivering the highest irradiance (a) and the lowest irradiance (b) during simulated curing of the Class V preparation. Again, there was substantial real-time variation in the irradiance delivered by these 2 operators. Both the Bluephase G2 unit and the VALO unit in standard mode deliver continuous output. The VALO unit in plasma mode, designated in the figure as "VALO (P)," delivers light for 3 seconds and then shuts off. For display purposes only, the pause time on the VALO unit in plasma mode was adjusted to fit with the 10-second overall curing time on these charts. For this mode, each operator was instructed to leave the unit off for about 3 seconds before initiating another 3-second curing cycle. The Demi curing light delivers light pulses every second. |
|
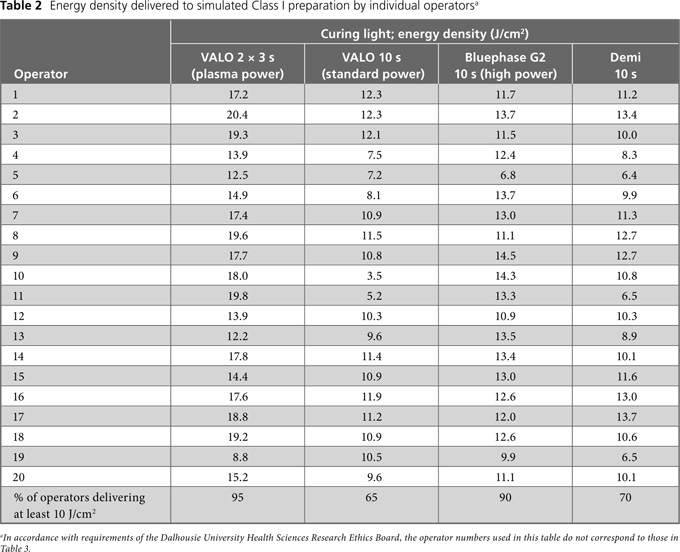
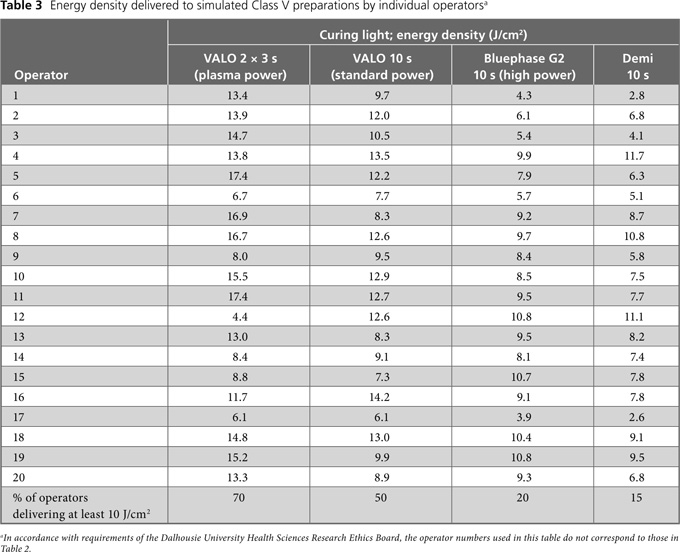
The energy delivered by the operators to the Class I preparation site (Table 2) and the Class V preparation site (Table 3) varied by individual operator and with curing light. To determine the practical implications of this variation, it is useful to compare the energy density delivered with the minimum energy density required to ensure that the bottom 2 mm of Filtek Supreme composite, shade A2B (3M ESPE, St. Paul, MN), reaches the clinically acceptable level of 80% of surface hardness (10 J/cm2).1 For the Class I preparation, the percentage of operators who delivered the minimum energy density of 10 J/cm2 was 95% with the VALO unit in plasma mode and 90% with the Bluephase G2 unit (Table 2). However, using the Demi unit and the VALO unit in standard mode, only 70% and 65% of the operators, respectively, delivered 10 J/cm2. For the Class V preparation, the percentage of operators who delivered the minimum of 10 J/cm2 was lower for each curing light: 70% for the VALO unit in plasma mode, 50% for the VALO unit in standard mode, 20% for the Bluephase G2 unit and 15% for the Demi unit (Table 3).
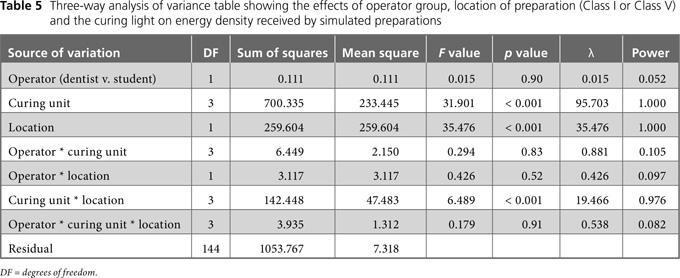
Summary statistics for the total light energy delivered by all operators (n = 20) are reported in Table 4. In general, the coefficient of variation for a given curing light was greater for the Class V preparation, except for the VALO unit operated in standard mode for 10 seconds. (Table 4). The correlations determined by 3-way ANOVA (Table 5) indicated no significant difference between dentist and student operators (p = 0.90). However, as a group, the 20 operators delivered significantly less energy to the Class V preparation than to the Class I preparation (p < 0.001). There was also a significant difference in the amount of energy delivered by each curing light (p < 0.001). At the Class I location, the VALO unit operated in plasma mode for two 3-second cycles delivered the most energy (16.4 ± 3.1 J/cm2) and the same unit operated in standard mode for 10 seconds delivered the least (9.9 ± 2.4 J/cm2) (p < 0.05; Fisher PLSD test for post hoc pairwise comparisons). At the Class V location, the VALO unit operated in plasma mode for two 3-second cycles delivered the most energy (12.5 ± 4.0 J/cm2), and the Demi unit, operated for 10 seconds, delivered the least energy (7.4 ± 2.5 J/cm2) (p < 0.05; Fisher PLSD test for post hoc pairwise comparisons).
Discussion
As shown in Tables 4 and 5, the light energy delivered to the Class I (Table 2) and Class V (Table 3) preparations varied significantly among the 20 operators (the range was from 2.6 J/cm2 to 20.4 J/cm2). Furthermore, the energy density delivered to the Class V preparation in the buccal region of tooth 37 was markedly less than that delivered to the occlusal Class I preparation in tooth 26 for 3 of the 4 experimental conditions (VALO unit used for two 3-second cycles in plasma mode, Bluephase G2 unit used for 10 seconds in high power mode and Demi unit used for 10 seconds). This difference indicates that accessibility to a restoration site has a significant effect on the clinician's ability to deliver adequate energy from the curing light to the restoration. Figs. 2 and 3 provide qualitative examples of the ability of the MARC system to track the irradiance delivered over time by each clinician. Using the same curing lights, one operator (Figs. 2a and 3a) delivered much higher and more consistent irradiance and energy than another operator (Figs. 2b and 3b) for the same types of restorative scenarios. This difference in performance illustrates the critical role of operator technique in delivering adequate energy density to a restoration. The VALO unit, used in the plasma mode for two 3-second cycles, had a low coefficient of variation (0.19) in the amount of energy delivered at the Class I location. Fig. 4 illustrates how the curved lens at the end of this curing light rested between the cusp tips, which would help the operator to stabilize the light over the detector at the Class I location. Conversely, Fig. 5 shows that the Class V preparation in tooth 37 was difficult to access for lights with a light guide, such as the Demi and Bluephase G2 curing lights. It was difficult for the operators to position these units directly over the Class V preparation because of limited space between the rubber cheeks of the mannequin and the tooth, and the energy density delivered was reduced accordingly (Table 4). A similar result would be expected in the clinical setting, with the patient's cheek interfering with positioning of the tip of the light guide directly over a Class V preparation. Although it was easier to reach the Class V preparation with the VALO unit, this light, when operated in the plasma mode, had a higher coefficient of variation (0.32) at the Class V location than the Class I location, possibly because the light had to be turned on twice to perform the two 3-second curing cycles. This manoeuvre required some repositioning of the light by the operators.
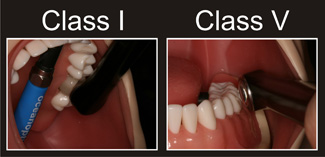 Figure 4: Simulated curing of Class I and Class V preparations with the VALO curing light. This unit was relatively easy to position between the cusps of the molar tooth, but the curved lens made it difficult to keep this light stationary over the Class V preparation.
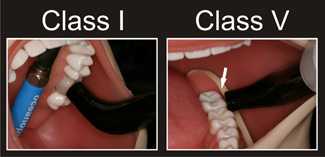 Figure 5: Simulated curing of Class I and Class V preparations by means of a curing light with a light guide. The Class V preparation site in tooth 37 was difficult to access because of the curing unit's light guide and the limited space between the mannequin's rubber cheek and the tooth. The end of the light guide is not perpendicular to the detector (arrow).
On the basis of a previous study,1 the target for energy delivery was set at 10 J/cm2, with the knowledge that more or less energy might be required to adequately polymerize some resins.1-7 The fact that many operators could not deliver the clinically relevant energy density of 10 J/cm2 suggests that some resin restorations placed in clinical practice may not be sufficiently polymerized. Failure to deliver the necessary energy for polymerization of a restoration may contribute to secondary caries, fracture of the restoration and marginal defects, which are the major reasons for failure of resin composite restorations.44-46
Clinical Implications
This study transfers curing light research from the laboratory environment to a clinical setting and has real-life implications. The results reported here illustrate the significant effects of operator technique, curing light and preparation location on the amount of energy delivered to a restoration.
The MARC device uses a laboratory-grade, NIST-referenced spectroradiometer to measure the irradiance delivered to simulated preparations. As such, the measurements obtained in this study are more accurate than those generated by dental radiometers.22,23 The observation that insufficient light energy may be delivered to preparations has both research and clinical implications. During laboratory research with a curing light, the unit is typically clamped rigidly directly over the specimen, which minimizes variability in the amount of energy delivered and helps to ensure that the specimens undergo adequate curing, as long as the required energy level is achieved. However, in this study there was much variability among clinical operators using the same curing light (Tables 2 and 3). Also, although many operators delivered less than 10 J/cm2, some delivered more. Given the potential for unacceptable temperature increases in the pulp and the oral soft tissues caused by delivering too much energy, as well as the potential for thermal damage to the pulp,36-40 it is inappropriate to arbitrarily increase exposure times without knowing how much energy is actually being delivered to the restoration.
Limitations
The lights used in this study were all relatively new and well maintained and as such probably delivered a higher irradiance than many of the curing lights in private practice.47 It is recognized that only one unit of each type of curing light was used in this study and that longer exposure times would deliver more energy. However, the irradiance delivered by each light was considered representative for the brand, and the curing lights selected for this study were thought to be representative of the wide variety of currently available models. Also, the exposure times used were those recommended by the manufacturers for curing a 2-mm increment of shade A3.5 or darker.
Conclusions
In this study, there was no difference between dentists and fourth-year dental students in their ability to deliver energy to a simulated preparation. However, the amount of energy delivered by individual operators varied widely, with a range from 2.6 J/cm2 up to 20.4 J/cm2. Furthermore, individual operators delivered different amounts of energy to Class I and Class V preparations with the same light units. Across all operators and light-curing units, significantly lower energy density was delivered to the Class V preparation than to the Class I preparation.
THE AUTHORS
|
Dr. Price is a professor in the department of dental clinical sciences, Dalhousie University, Halifax, Nova Scotia. |
|
|
Mr. Felix is a research assistant in the department of dental clinical sciences, Dalhousie University, Halifax, Nova Scotia. |
|
|
Dr. Whalen is an assistant professor in the department of chemistry, Dalhousie University, Halifax, Nova Scotia. |
Acknowledgements: The authors would like to thank Mr. J. Fahey for his statistical support. The manufacturers of the curing lights used in this study are acknowledged for their kind donations. This project was supported by Dalhousie University.
Dr. Price and Mr. Felix are the inventors of the Managing Accurate Resin Curing (MARC) device. Dalhousie University owns and has applied for a patent for this device. Dalhousie University licensed the MARC device to BlueLight analytics inc., Halifax, NS, after this research was completed. Dr. Price, Mr. Felix and Dr. Whalen have all declared financial interest in BlueLight analytics inc.
Correspondence to: Dr. Richard Price, Department of dental clinical sciences, Dalhousie University, Halifax, NS B3H 1W2.
This article has been peer reviewed.
References
- Price RB, McLeod ME, Felix CA. Quantifying light energy delivered to a Class I restoration. J Can Dent Assoc. 2010;76:a23.
- Schattenberg A, Lichtenberg D, Stender E, Willershausen B, Ernst CP. Minimal exposure time of different LED-curing devices. Dent Mater. 2008;24(8):1043-9. Epub 2008 Jan 31.
- Fan PL, Schumacher RM, Azzolin K, Geary R, Eichmiller FC. Curing-light intensity and depth of cure of resin-based composites tested according to international standards. J Am Dent Assoc. 2002;133(4):429-34.
- Yap AU, Seneviratne C. Influence of light energy density on effectiveness of composite cure. Oper Dent. 2001;26(5):460-6.
- Calheiros FC, Daronch M, Rueggeberg FA, Braga RR. Degree of conversion and mechanical properties of a BisGMA:TEGDMA composite as a function of the applied radiant exposure. J Biomed Mater Res B Appl Biomater. 2008;84(2):503-9.
- Lovell LG, Newman SM, Donaldson MM, Bowman CN. The effect of light intensity on double bond conversion and flexural strength of a model, unfilled dental resin. Dent Mater. 2003;19(6):458-65.
- Calheiros FC, Kawano Y, Stansbury JW, Braga RR. Influence of radiant exposure on contraction stress, degree of conversion and mechanical properties of resin composites. Dent Mater. 2006;22(9):799-803.
- Rode KM, Kawano Y, Turbino ML. Evaluation of curing light distance on resin composite microhardness and polymerization. Oper Dent. 2007;32(6):571-8.
- Aravamudhan K, Rakowski D, Fan PL. Variation of depth of cure and intensity with distance using LED curing lights. Dent Mater. 2006;22(11):988-94. Epub 2006 Feb 16.
- Xu X, Sandras DA, Burgess JO. Shear bond strength with increasing light-guide distance from dentin. J Esthet Restor Dent. 2006;18(1):19-27; discussion 28.
- Felix CA, Price RB. The effect of distance from light source on light intensity from curing lights. J Adhes Dent. 2003;5(4):283-91.
- American Dental Association. Spectral curing lights and evolving technology. ADA Professional Product Review. Chicago: American Dental Association; Fall 2009; Vol. 4, Issue 4.
- Vandewalle KS, Roberts HW, Rueggeberg FA. Power distribution across the face of different light guides and its effect on composite surface microhardness. J Esthet Restor Dent. 2008;20(2):108-117; discussion 118.
- Price RB, Dérand T, Sedarous M, Andreou P, Loney RW. Effect of distance on the power density from two light guides. J Esthet Dent. 2000;12(6):320-7.
- Nitta K. Effect of light guide tip diameter of LED-light curing unit on polymerization of light-cured composites. Dent Mater. 2005;21(3):217-23.
- Vandewalle KS, Roberts HW, Andrus JL, Dunn WJ. Effect of light dispersion of LED curing lights on resin composite polymerization. J Esthet Restor Dent. 2005;17(4):244-54; discussion 254-5.
- Corciolani G, Vichi A, Davidson CL, Ferrari M. The influence of tip geometry and distance on light-curing efficacy. Oper Dent. 2008;33(3):325-31.
- Lindberg A, Emami N, van Dijken JW. A Fourier transform Raman spectroscopy analysis of the degree of conversion of a universal hybrid resin composite cured with light-emitting diode curing units. Swed Dent J. 2005;29(3):105-12.
- Owens BM. Evaluation of curing performance of light-emitting polymerization units. Gen Dent. 2006;54(1):17-20.
- Torno V, Soares P, Martin JM, Mazur RF, Souza EM, Vieira S. Effects of irradiance, wavelength, and thermal emission of different light curing units on the Knoop and Vickers hardness of a composite resin. J Biomed Mater Res B Appl Biomater. 2008;85(1):166-71.
- Staudt CB, Krejci I, Mavropoulos A. Bracket bond strength dependence on light power density. J Dent. 2006;34(7):498-502. Epub 2006 Jan 8.
- Leonard DL, Charlton DG, Hilton TJ. Effect of curing-tip diameter on the accuracy of dental radiometers. Oper Dent. 1999;24(1):31-7.
- Roberts HW, Vandewalle KS, Berzins DW, Charlton DG. Accuracy of LED and halogen radiometers using different light sources. J Esthet Restor Dent. 2006;18(4):214-22; discussion 223-4.
- Caldas DB, de Almeida JB, Correr-Sobrinho L, Sinhoreti MA, Consani S. Influence of curing tip distance on resin composite Knoop hardness number using three different light curing units. Oper Dent. 2003;28(3):315-20.
- Correr AB, Sinhoreti MA, Sobrinho LC, Tango RN, Schneider LF, Consani S. Effect of the increase of energy density on Knoop hardness of dental composites light-cured by conventional QTH, LED and xenon plasma arc. Braz Dent J. 2005;16(3):218-24. Epub 2006 Jan 12.
- Lohbauer U, Rahiotis C, Krämer N, Petschelt A, Eliades G. The effect of different light-curing units on fatigue behavior and degree of conversion of a resin composite. Dent Mater. 2005;21(7):608-15.
- Kim SY, Lee IB, Cho BH, Son HH, Um CM. Curing effectiveness of a light emitting diode on dentin bonding agents. J Biomed Mater Res B Appl Biomater. 2006;77(1):164-70.
- Ferracane JL, Mitchem JC, Condon JR, Todd R. Wear and marginal breakdown of composites with various degrees of cure. J Dent Res. 1997;76(8):1508-16.
- Vandewalle KS, Ferracane JL, Hilton TJ, Erickson RL, Sakaguchi RL. Effect of energy density on properties and marginal integrity of posterior resin composite restorations. Dent Mater. 2004;20(1):96-106.
- de Souza Costa CA, Hebling J, Hanks CT. Effects of light-curing time on the cytotoxicity of a restorative resin composite applied to an immortalized odontoblast-cell line. Oper Dent. 2003;28(4):365-70.
- Franz A, König F, Anglmayer M, Rausch-Fan X, Gille G, Rausch WD, et al. Cytotoxic effects of packable and nonpackable dental composites. Dent Mater. 2003;19(5):382-92.
- Knezevic A, Zeljezic D, Kopjar N, Tarle Z. Cytotoxicity of composite materials polymerized with LED curing units. Oper Dent. 2008;33(1):23-30.
- Uhl A, Völpel A, Sigusch BW. Influence of heat from light curing units and dental composite polymerization on cells in vitro. J Dent. 2006;34(4):298-306. Epub 2005 Sep 19.
- Sigusch BW, Volpel A, Braun I, Uhl A, Jandt KD. Influence of different light curing units on the cytotoxicity of various dental composites. Dent Mater. 2007;23(11):1342-8. Epub 2007 Jan 16.
- Brambilla E, Gagliani M, Ionescu A, Fadini L, Garcia-Godoy F. The influence of light-curing time on the bacterial colonization of resin composite surfaces. Dent Mater. 2009;25(9):1067-72. Epub 2009 Apr 17.
- Baroudi K, Silikas N, Watts DC. In vitro pulp chamber temperature rise from irradiation and exotherm of flowable composites. Int J Paediatr Dent. 2009;19(1):48-54. Epub 2008 Feb 19.
- Santini A, Watterson C, Miletic V. Temperature rise within the pulp chamber during composite resin polymerisation using three different light sources. Open Dent J. 2008;2:137-41.
- Guiraldo RD, Consani S, Lympius T, Schneider LF, Sinhoreti MA, Correr-Sobrinho L. Influence of the light curing unit and thickness of residual dentin on generation of heat during composite photoactivation. J Oral Sci. 2008;50(2):137-42.
- Durey K, Santini A, Miletic V. Pulp chamber temperature rise during curing of resin-based composites with different light-curing units. Prim Dent Care. 2008;15(1):33-8.
- Bagis B, Bagis Y, Ertas E, Ustaomer S. Comparison of the heat generation of light curing units. J Contemp Dent Pract. 2008;9(2):65-72.
- Millen C, Ormond M, Richardson G, Santini A, Miletic V, Kew P. A study of temperature rise in the pulp chamber during composite polymerization with different light-curing units. J Contemp Dent Pract. 2007;8(7):29-37.
- Bouillaguet S, Caillot G, Forchelet J, Cattani-Lorente M, Wataha JC, Krejci I. Thermal risks from LED- and high-intensity QTH-curing units during polymerization of dental resins. J Biomed Mater Res B Appl Biomater. 2005;72(2):260-7.
- Gallagher C, Gallagher V, Whelton H, Cronin M. The normal range of mouth opening in an Irish population. J Oral Rehabil. 2004;31(2):110-6.
- Opdam NJ, Bronkhorst EM, Roeters JM, Loomans BA. A retrospective clinical study on longevity of posterior composite and amalgam restorations. Dent Mater. 2007;23(1):2-8. Epub 2006 Jan 18.
- Bernardo M, Luis H, Martin MD, Leroux BG, Rue T, Leitão J, et al. Survival and reasons for failure of amalgam versus composite posterior restorations placed in a randomized clinical trial. J Am Dent Assoc. 2007;138(6):775-83.
- Sunnegardh-Gronberg K, van Dijken JW, Funegård U, Lindberg A, Nilsson M. Selection of dental materials and longevity of replaced restorations in Public Dental Health clinics in northern Sweden. J Dent. 2009;37(9):673-8. Epub 2009 May 4.
- Ernst CP, Busemann I, Kern T, Willershausen B. Feldtest zur Lichtemissionsleistung von Polymerisationsgeräten in zahnärztlichen Praxen. Deutsche Zahnärztliche Zeitschrift. 2006;61(9):466-71.