Abstract
Objectives:
This study evaluated the impact of blinding shade guide tabs on the accuracy of colour selection and the preference for shades in the A hue category.
Methods
Disc-shaped specimens were created in 8 shades: 4 in the A hue (A1, A2, A3, A4) and 4 in different hues (B1, B2, C2, D3). Using both blinded and unblinded guides, 15 dental students and 15 experienced dentists evaluated the specimens’ shades. Colour accuracy was assessed using the overall colour difference (ΔE00) and individual colour coordinates (CIELCH system) between the selected shade tab and the actual specimen. The percentage of selections favouring the A hue was also calculated.
Results:
Blinding the shade guide tabs did not significantly impact the accuracy of colour selection. However, unblinded evaluations resulted in a higher percentage of selections favouring the A hue (44%) compared with blinded evaluations (34%). No significant difference was found between the evaluations of dental students and experienced dentists.
Conclusions:
Blinding shade guide tabs did not affect the precision of colour selection but reduced the tendency to choose shades in the A hue category.
Introduction
Background
Creating esthetically pleasing dental restorations is a complex task in restorative dentistry. Although replicating the shape of the restoration is important, achieving colour harmony with surrounding natural teeth is equally crucial. This challenge becomes even greater when working with partial direct restorations, where the composite resin must match the shade of the adjacent tooth structure.1,2
Clinical Limitations
To address this challenge, colour selection systems have been developed to help dentists choose composite resins that blend well with the colour of the tooth being restored.3 These systems also offer shade guidance for dental technicians creating indirect restorations.4 The basic concept is straightforward: dentists select a colour from colour guides available in their clinics, which align with standards followed by manufacturers who produce restorative materials.
In dentistry, one of the most widely used colour scales is the VITA system (Vita-Zahnfabrik, Bad Säckinge, Germany), which serves as a reference for many composite and ceramic manufacturers. The VITA classic shade guide consists of 16 tabs and is based on 2 key properties: hue (colour tone) and chroma (colour intensity). This system categorizes natural teeth into 4 primary hues: A (reddish brown), B (orange-yellow), C (grey-green) and D (grey-pink).5 However, even though all 4 hues are available, hue A represents nearly 80% of natural tooth colours.6 Although some manufacturers follow the classic VITA shade guide, discrepancies have been observed between the shades on these guides and the actual colour of the restorative materials, even from the same manufacturer.7
Study Rationale
In addition to colour selection systems, the accuracy of colour determination also relies significantly on the dentist’s visual assessment skills.8,9 However, the visual approach is limited by environmental factors, such as lighting conditions and the subjective nature of human perception.9 Although research has explored the impact of clinician-related factors, including gender and experience, on shade selection,10-12 the potential influence of cognitive biases on dentists’ colour choices remains relatively unexplored.
This study aimed to investigate how blinding the shade guide tabs affects the precision of visual colour determination and the percentage of dentists who choose shades within the A hue category. We hypothesized that blinding the shade guide tabs would not have a significant impact on either the accuracy of colour selection or selection of shades in the A hue. In addition, we hypothesized that no significant differences would be observed between the evaluations of dental students and experienced dentists.
Methods and Materials
Study Design
This study investigated the influence of 2 independent variables on shade selection in dentistry: evaluator type (undergraduate dental students versus experienced dentists) and blinding of shade guide tabs. The study assessed the precision of shade determination, measured as the difference in colour (ΔE00) and CIELCH coordinates between the selected shade tab and the actual specimen. We also calculated the percentage of hue A tabs selected.
Specimen Preparation
A disc-shaped specimen (10-mm diameter, 2-mm thickness) was created for each composite shade under evaluation. The composite used was Tetric N-Ceram (Ivoclar, Schan, Lichtenstein), with 4 shades from hue A (A1, A2, A3, A4) and 4 from other hues (B1, B2, C2, D3), all with universal translucency. Composite specimens were created by filling a metallic matrix with a single insertion of material. The specimens were light cured using a Valo Cordless unit (Ultradent Products, South Jordan, Utah, USA), positioned 2 mm from the matrix for 20 s in standard mode with an irradiance of 2000 mW/cm2 as specified by the manufacturer. Specimens were then polished with aluminum oxide discs (Sof-lex, 3M ESPE Oral Care, St. Paul, Minn., USA).
Visual Evaluations
We recruited 30 evaluators to assess the shade of unidentified composite specimens using the manufacturer-supplied shade guide (Ivoclar Vivadent, Schaan, Liechtenstein). The shades in this composite system are aligned with those of the VITA classic shade guide. Participants included 15 undergraduate dental students in their 2nd and 3rd years of a 5-year program, whose experience in composite shade determination was limited to theoretical coursework. The remaining evaluators were dentists specializing in restorative dentistry or dental prosthetics. All participants provided written informed consent before participating. The ability of evaluators to discriminate among colours was assessed using Ishihara colour plates (available at: https://www.color-blind-test.com), and all evaluators demonstrated adequate visual ability.
All evaluations were conducted within a controlled viewing booth illuminated by 4 30-watt lamps providing D65 illuminant (CRI ≥ 90). Specimens were placed on a neutral grey sample holder tilted 45° relative to the light source. For blinded evaluation, shade guide tabs were masked using opaque tape for the initial evaluation phase. For each evaluator, individual specimens were presented in random order, generated using the “random” function in Excel 365 (Microsoft, Redmond, Wash., USA). Following the blinded phase, the tape was removed to unblind the shade guide tabs for assessment.
Instrumental Colour Measurement
The colour of both the specimens and shade guide tabs was measured using a calibrated clinical spectrophotometer (VITA Easyshade V, Vita-Zahnfabrik, Bad Säckingen, Germany) in basic shade-measurement mode. For each measurement, the following colour coordinates were recorded: L* (lightness), a* (red-green axis), b* (blue-yellow axis), C (chroma), and H (hue).
The overall colour difference between the tabs selected by the evaluators and the specimens was calculated using the following equation:13,14
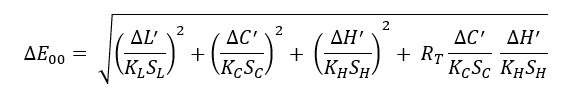
Where: ΔL′, ΔC′ and ΔH′ represent differences in lightness, chroma and hue, respectively. SL, SC and SH are the weighted functions for each component (set to 1 in this formula). KL, KC and KH are the weighted factors for lightness, chroma and hue (set to 1 in this formula). RT is the interactive term between chroma and hue differences. Instrumental colour measurements were performed in triplicate, and the average of the measurements was used for statistical analysis.
Data Analysis
To ensure that the data met the requirements for statistical analysis, we checked for normal distribution using the Shapiro-Wilk test and verified equal variance across groups with Levene’s test. We used a repeated-measures ANOVA to compare the overall colour difference (ΔE00) and the percentage of tabs selected in the A hue category, as this test is well-suited for analyzing data collected under different conditions (blinded vs. unblinded). To explore how independent variables influenced the colour differences (CIELCH system), we conducted a MANOVA, which allows for the simultaneous analysis of multiple related outcomes. All analyses were performed at a 95% confidence level using the open-source software Jamovi 1.6.15 (www.jamovi.org).
Results
Figure 1 summarizes the overall colour discrepancy between chosen tabs and the specimen’s colour. A repeated-measures ANOVA revealed no significant effects of either evaluator (p = 0.527) or evaluation method (p = 0.158) on these discrepancies. In addition, the interaction between these factors was not significant (p = 0.851).
Figure 2 shows differences between the selected tabs and the specimen’s colour, expressed using CIELCH colour space coordinates, lightness, chroma and hue. A multivariate analysis using MANOVA found no significant effects of evaluator (p = 0.447) or evaluation method (p = 0.253) on these colour differences. The interaction term also showed borderline significance (p = 0.082). These findings align with the results of individual univariate tests conducted for each colour coordinate (p ranging from 0.067 to 0.712).
Figure 3 reports the percentages of hue A selected by the evaluators. Repeated-measures ANOVA revealed a significant effect only for the evaluation method (p = 0.009). The factors evaluator (p = 0.217) and their interaction (p = 1.000) did not have significant effects. Notably, unblinded evaluators selected significantly higher percentage of tabs corresponding to hue A (42–46%) compared with blinded evaluators (32–36%).
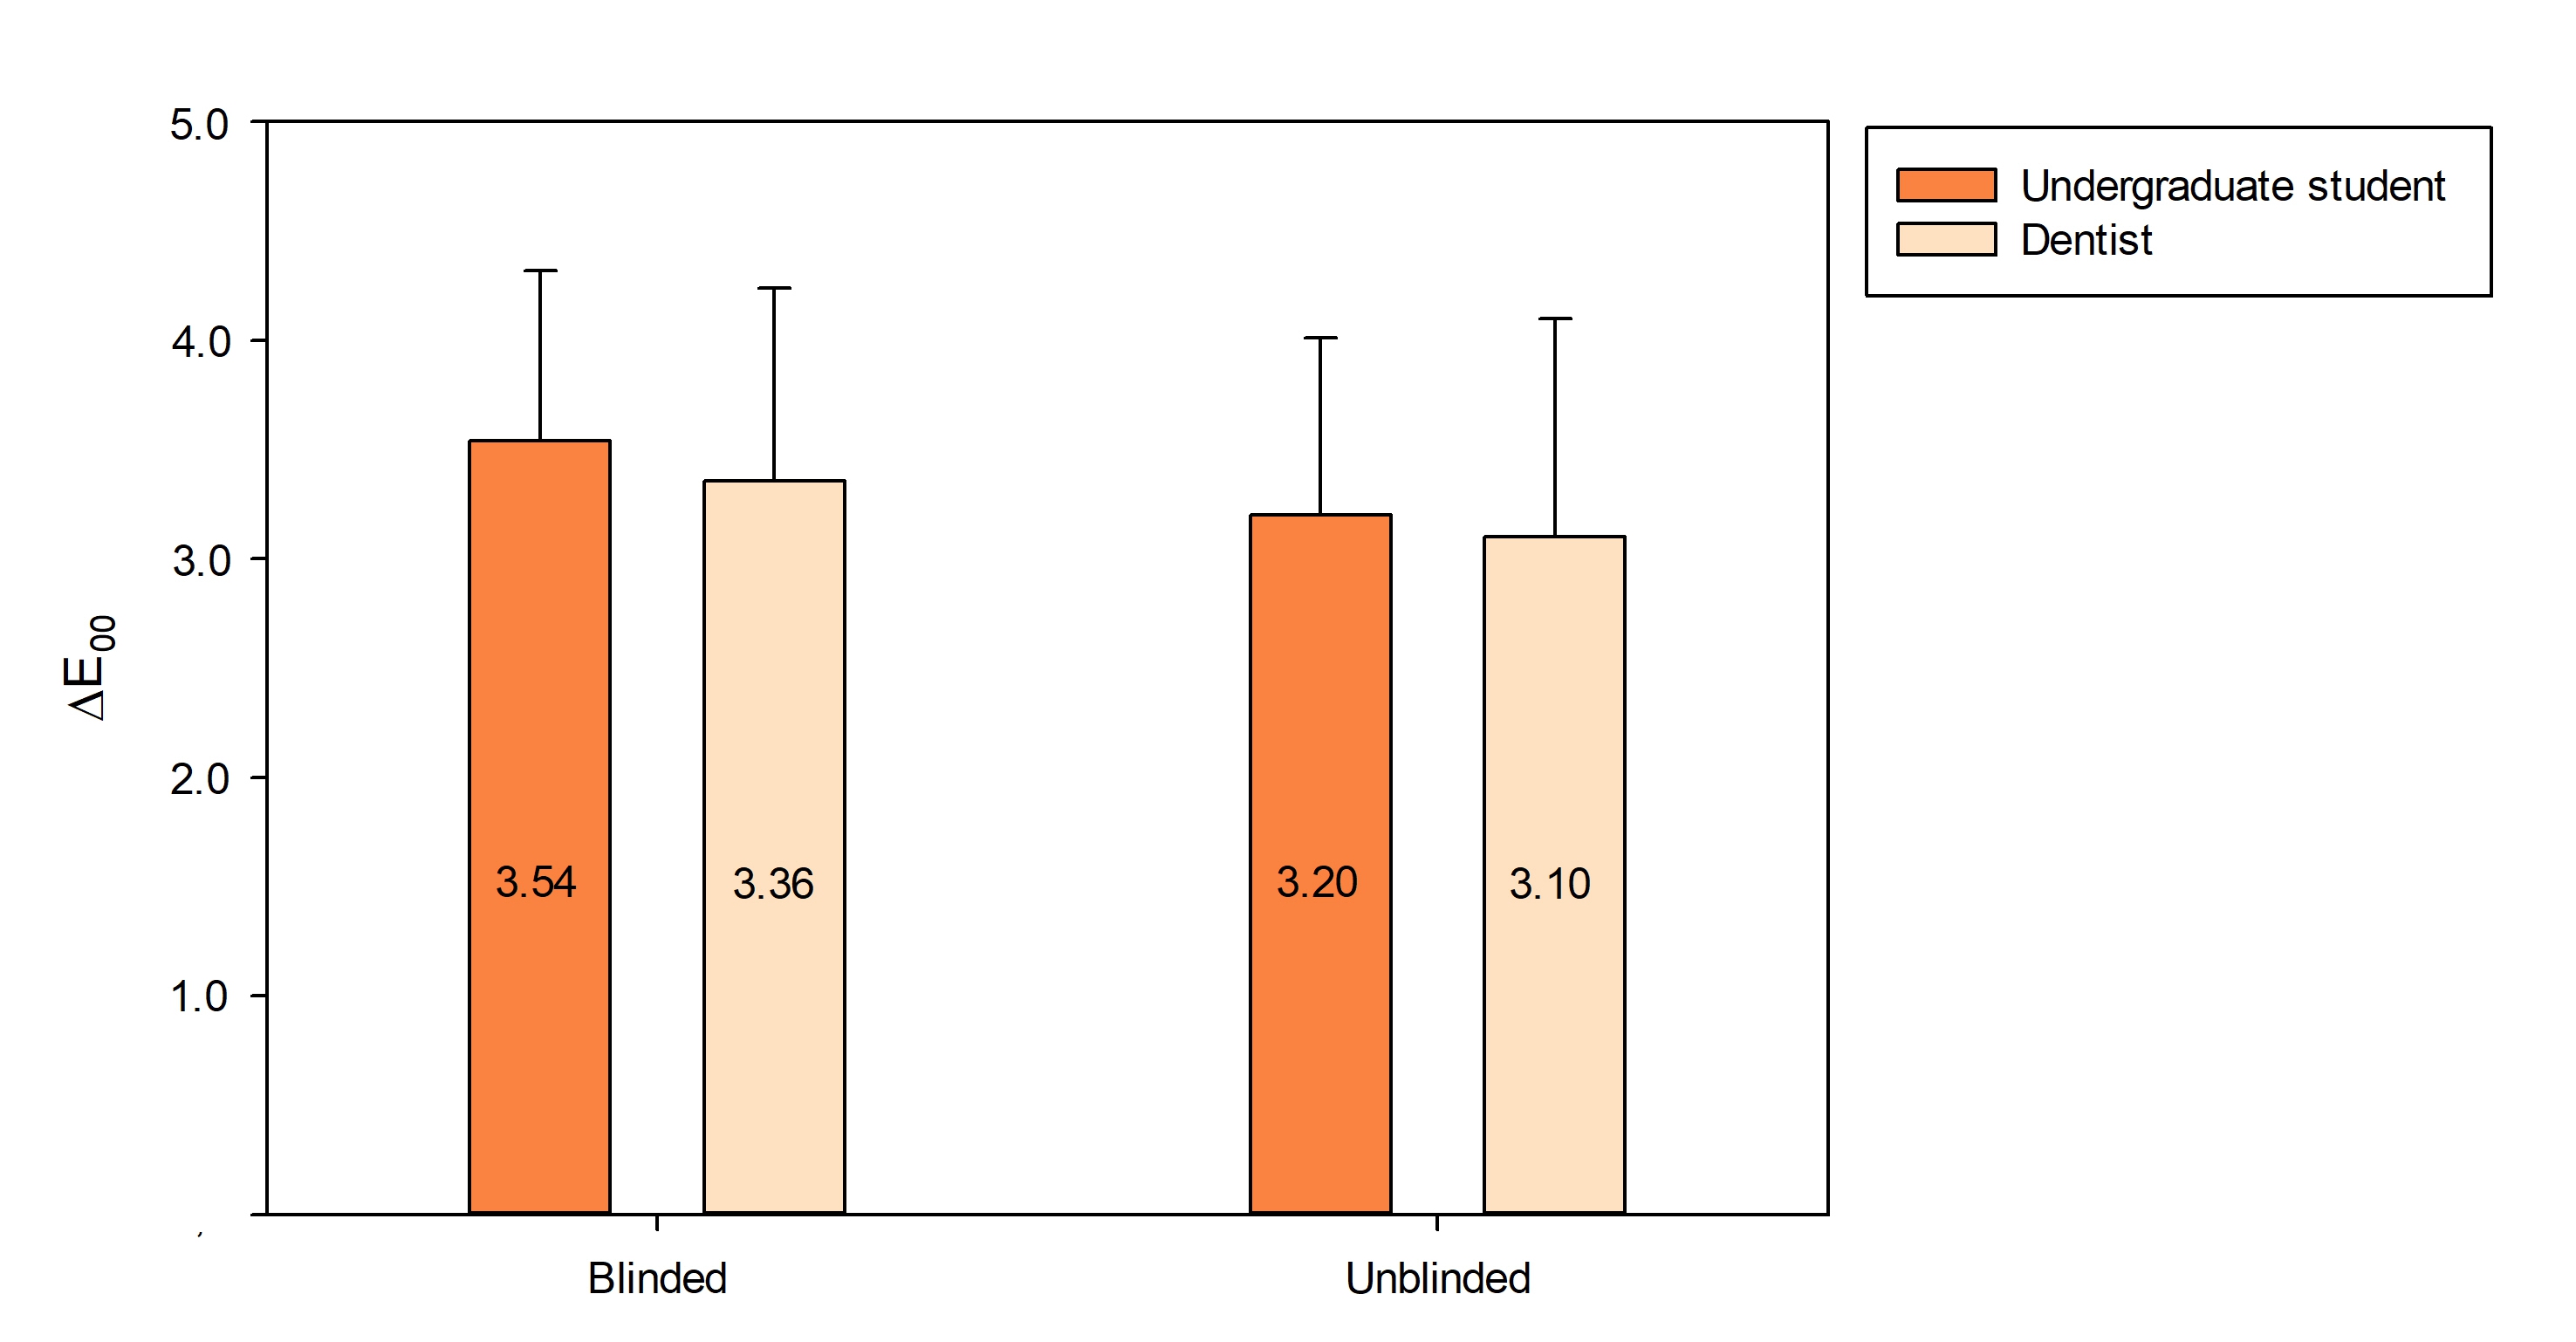
Figure 1: Mean colour differences (ΔE00 with standard deviations) between selected shade guide tabs and evaluated specimens (n = 15). Neither the evaluator nor the evaluation method had a significant effect on the results.
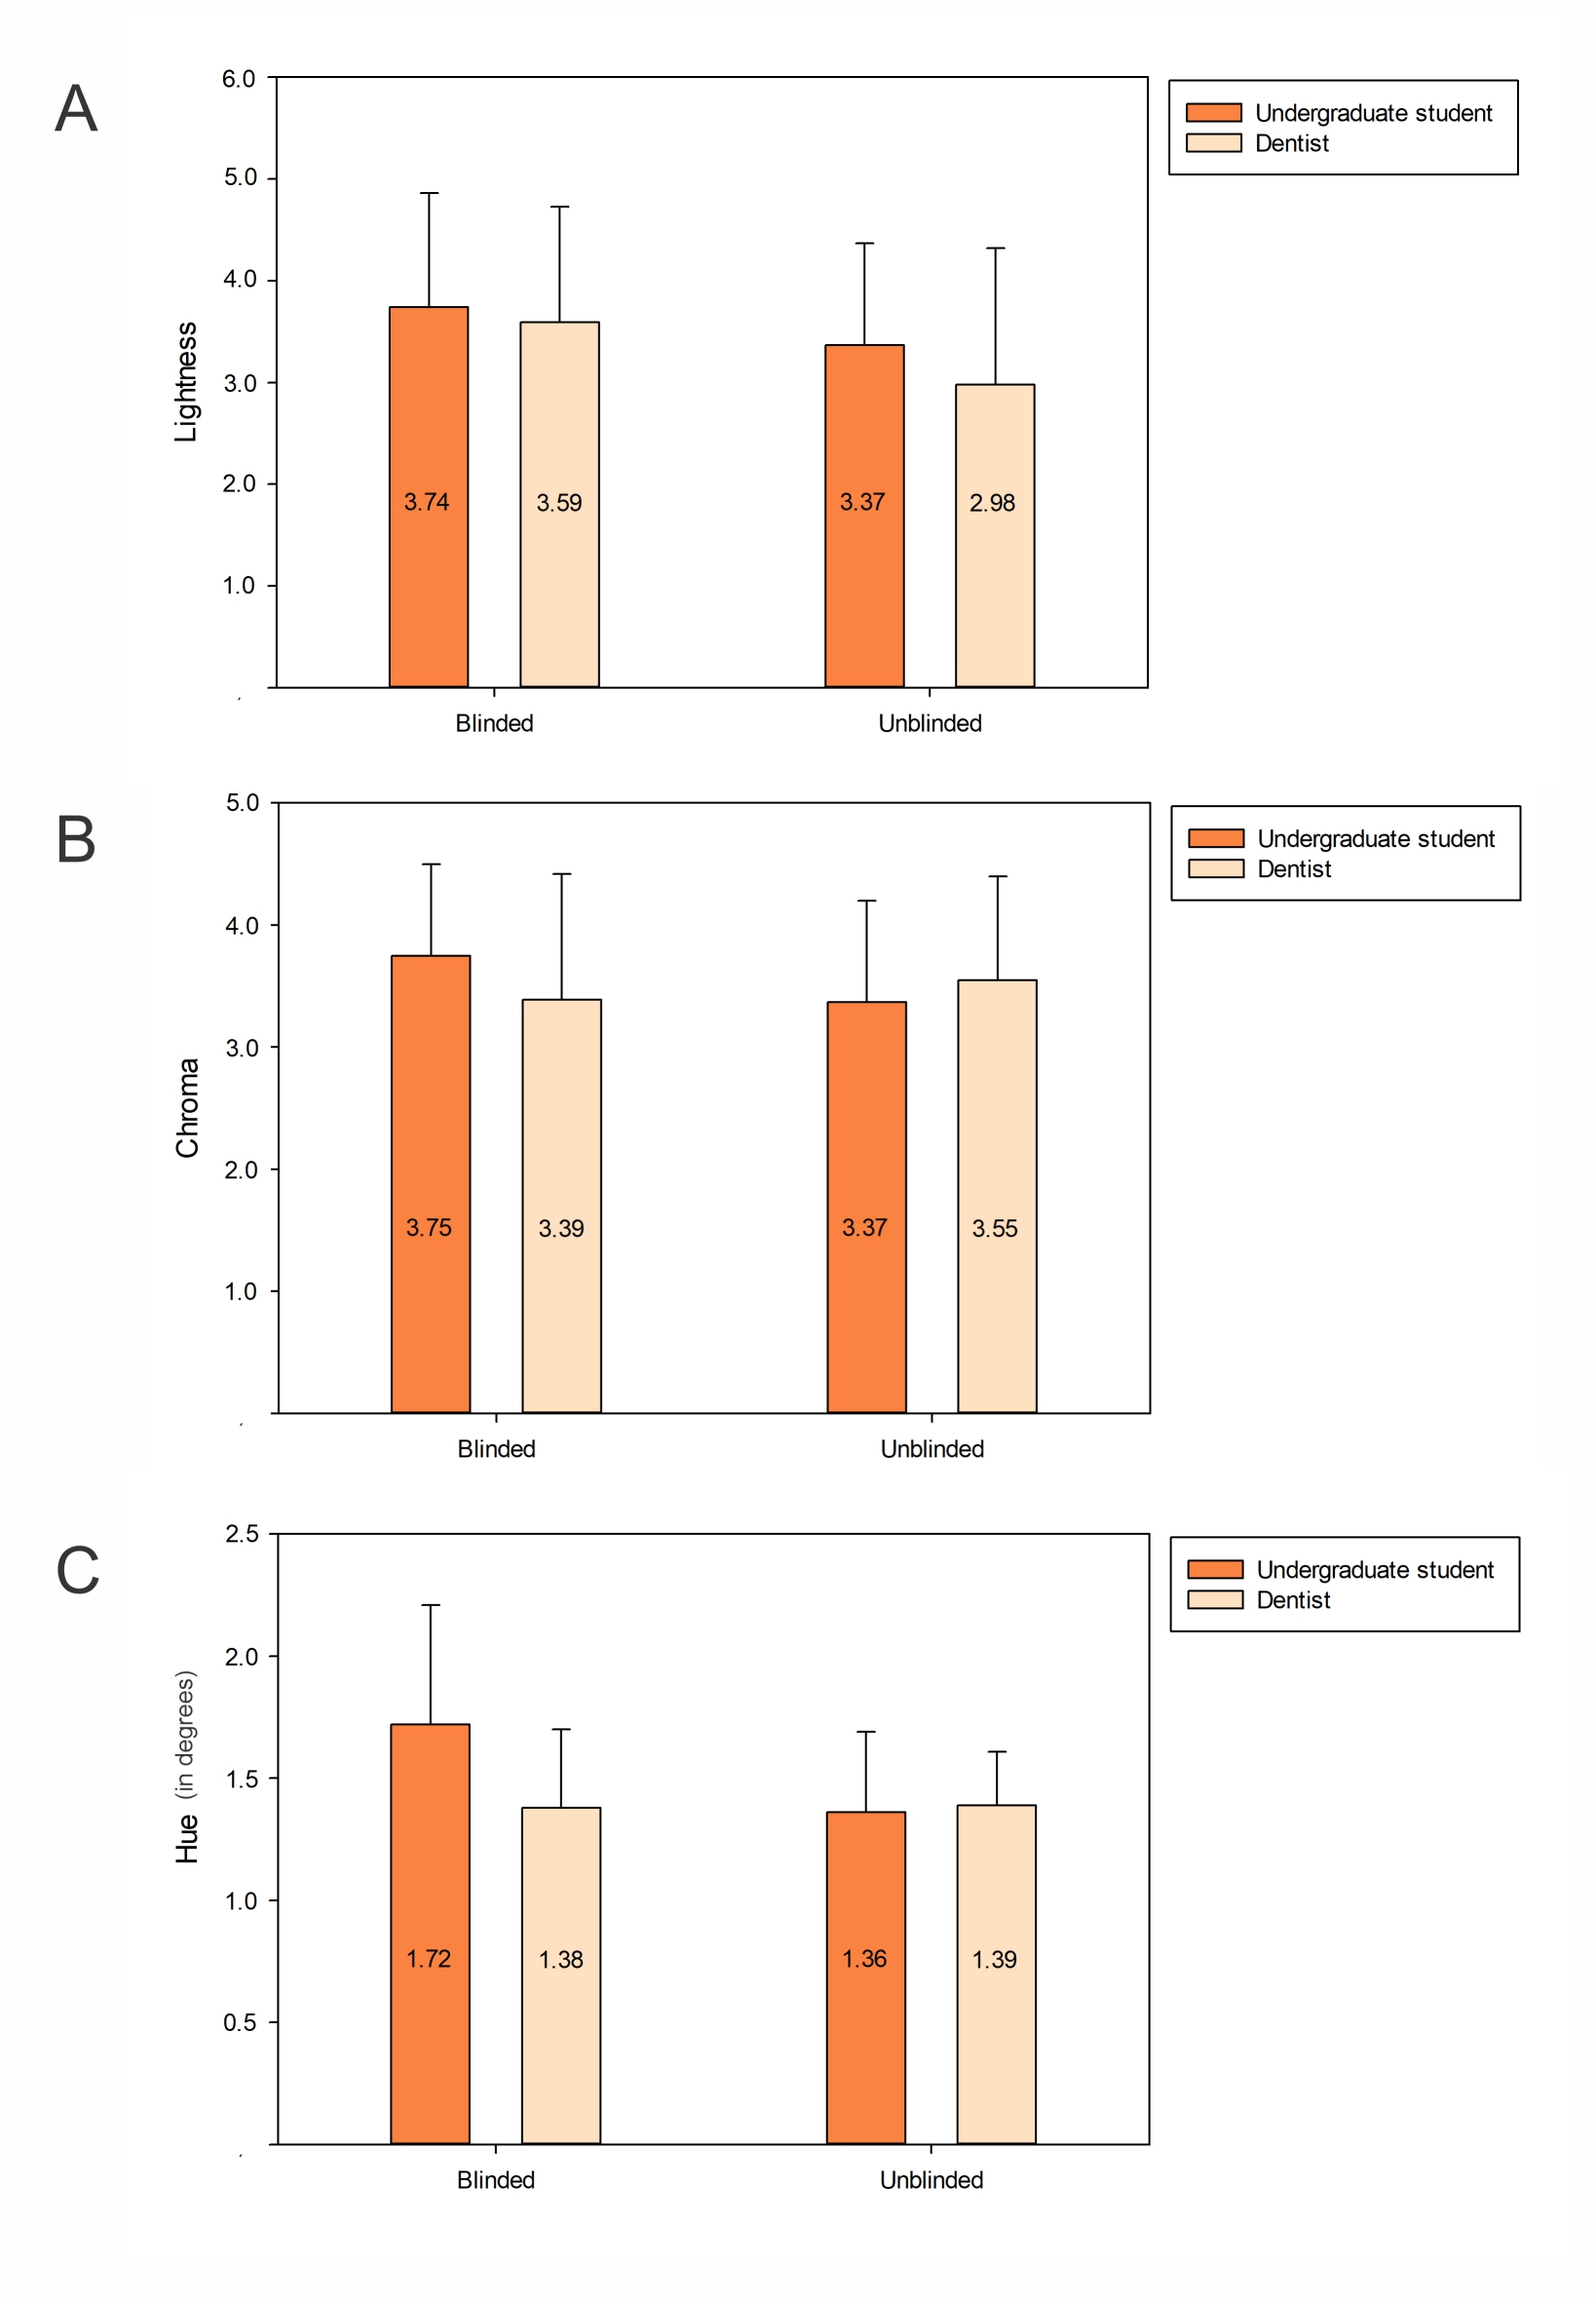
Figure 2: Mean colour differences (ΔE00 with standard deviations) for A. Lightness, B. Chroma, and C. Hue between selected shade guide tabs and evaluated specimens across coordinates in the CIELCH colour space (n = 15). Differences in colour coordinates were not affected by the evaluator nor the evaluation method.
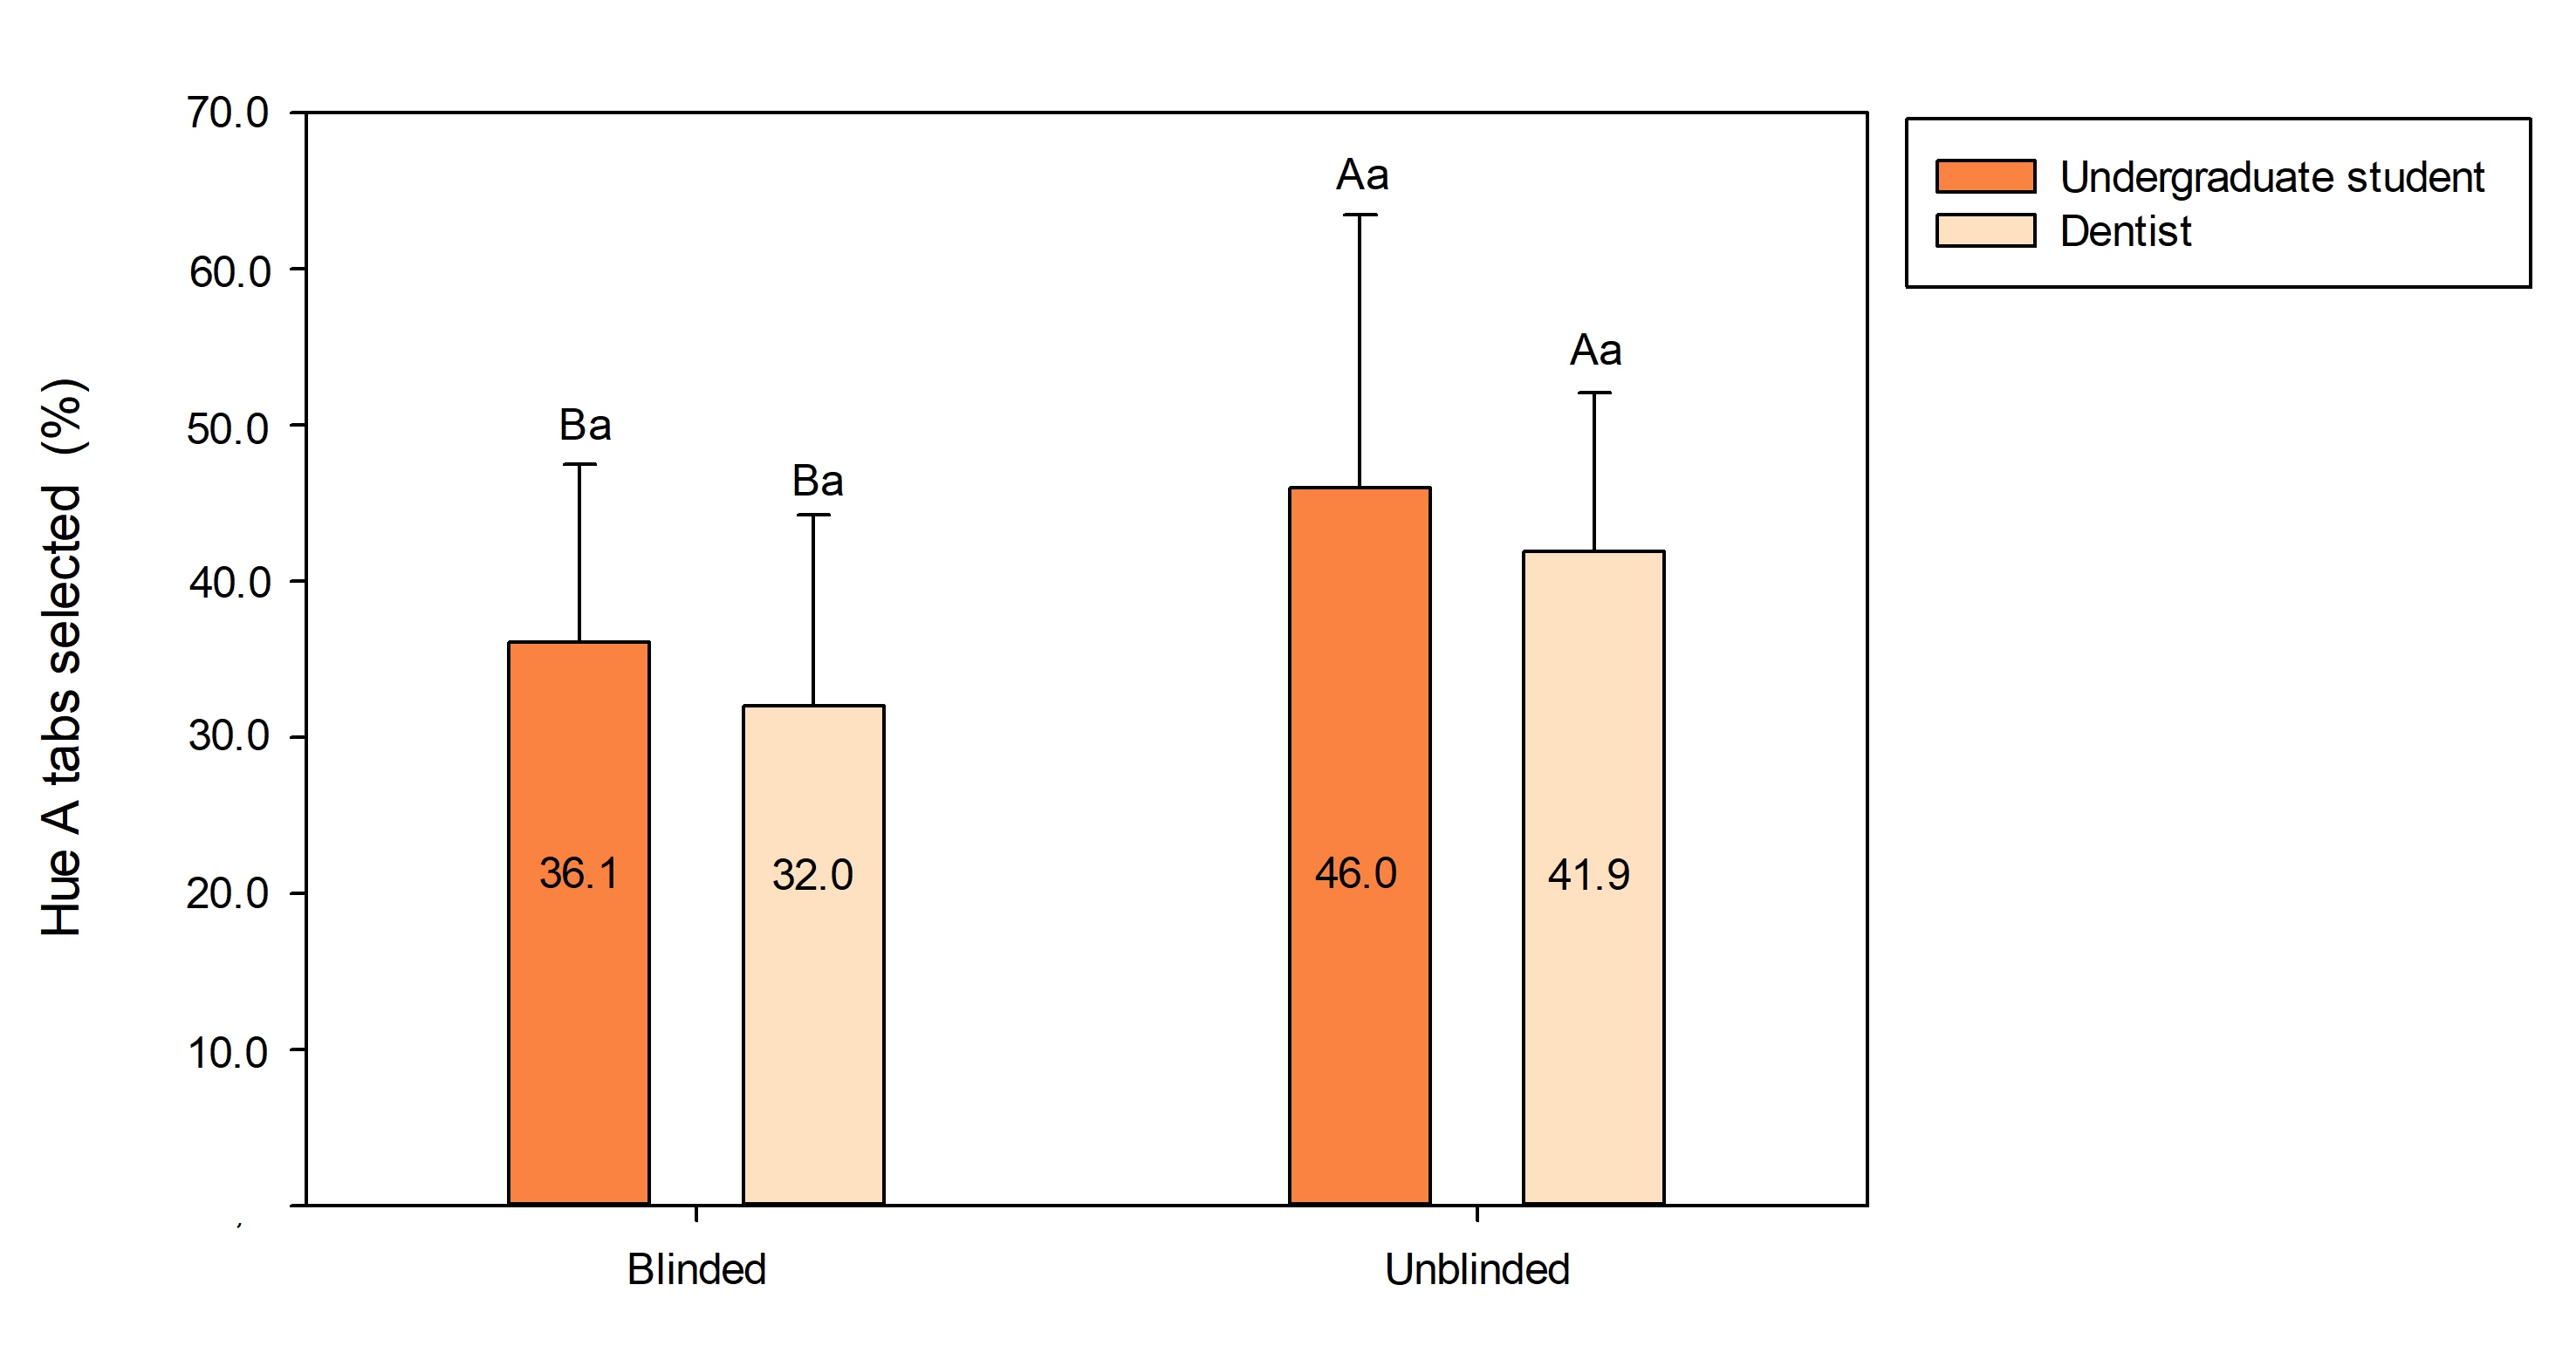
Figure 3: Mean percentages (with standard deviations) of hue A tabs selected by the evaluators according to the evaluation method (n = 15). Distinct letters (uppercase comparing the evaluation methods, lowercase comparing the evaluators) indicate statistical difference (p < 0.05).
Discussion
Our study’s findings confirm the first hypothesis: blinding the shade guide tabs did not affect the accuracy of composite shade determination. Precision was assessed by comparing the instrumental colour measurements of chosen tabs with the composite specimens.
An alternative method for precision determination could involve calculating the percentage of shades accurately matched. However, some colour discrepancies (ranging from 0.36 for C2 to 1.58 for A1) were observed between tabs and corresponding composite specimens. It is noteworthy that all ΔE00 values remained below a pre-established 50:50% acceptability threshold of 1.7,15 suggesting that these variations would unlikely have any clinical impact. In addition, discrepancies for shades C2 and D3 (0.42) fell below the visual detection threshold (0.7).15 Furthermore, tabs other than the corresponding shade could also show acceptable colour matches. Therefore, using only the percentage of corresponding shades selected might underestimate precision. This method wouldn’t account for situations where multiple tabs fall within the acceptable range, potentially leading to an underestimation of the evaluators’ visual accuracy.
However, the study raises concerns about the inherent limitations of shade guide tabs. Average ΔE00 values (3.10–3.54) were significantly higher than the clinically acceptable threshold (1.7),15 suggesting potential inaccuracies in colour selection, even for experienced clinicians. Notably, in some cases, the shade tab that provided the best visual match still resulted in a ΔE00 value close to the acceptable threshold. This highlights the limitations of relying solely on ΔE00 between tabs and composites. Therefore, the primary takeaway is that blinding did not affect colour determination, but the accuracy of shade selection itself deserves further exploration.
The study also assessed hue accuracy by analyzing individual CIELCH colour coordinates. As for overall colour determination, blinding did not affect hue selection. However, focusing solely on hue can be misleading. For instance, for a composite with a hue A, selecting a tab with hue B (which has a higher hue angle) or hue C (which typically has a lower hue angle) could lead to similar deviations in the hue coordinate relative to the composite. Furthermore, hue itself seems to have limited clinical impact.16,17 Shades with similar lightness/darkness values (whiter/darker) but different hues can often produce similar esthetic results.18,19 Therefore, like overall colour precision, calculating the percentage of “correct” hue matches (matching the specimen’s tab-hue) might result in low concordance rates; however, these low rates wouldn’t necessarily translate into poor clinical outcomes.
Although no significant differences in hue values were observed between blinded and unblinded tabs, unblinding the tabs significantly increased the proportion of selections in the hue A category. Therefore, the study’s second hypothesis cannot be accepted. The study design categorized composite shades as A or non-A hues (B, C or D). Consequently, an ideal shade determination would result in a 50% distribution for hue A. However, the shade guide included only 31.3% of tabs in the hue A category, i.e., the percentage resulting from chance selection. Intriguingly, the blinded evaluation yielded an average selection of hue A tabs at 34%, close to the chance expectation. However, this percentage increased to 44% when evaluators were aware of the tabs they were selecting, indicating the presence of cognitive biases in the evaluation process.
It is well known that most teeth align closely with the hue A colour range, with A3 being the most common shade followed by A2.6 This prevalence of hue A shades significantly impacts the dental market, where composite materials in the A category are the top sellers. In contrast, finding composites in shades C or D can sometimes prove challenging. This context sets the stage for evaluators to potentially reinforce their existing beliefs and initial hypotheses, often favouring the most familiar option. This inclination of evaluators to uphold their preconceived notions, particularly the ones that align closely with their expectations, can explain the patterns observed in this study. This tendency embodies what is known as congruency bias, a specific facet of confirmation bias.20 It involves individuals relying on their existing beliefs and overlooking alternative possibilities, such as considering non-A composite shades.
Another psychological factor that could contribute to these findings is the overconfidence effect. This bias tends to make people excessively confident in their viewpoints, leading them to disregard or downplay alternatives.21 Consequently, even relatively less experienced evaluators, such as undergraduate students, might be certain that composite shades are more likely to fall within the hue A spectrum, based on their past encounters and learned patterns. Notably, no significant difference was observed between the evaluations of dental students and experienced dentists, supporting our acceptance of the study’s final hypothesis. We assessed whether the operator’s level of experience influences their shade determination decisions by engaging undergraduate dental students and dentists specializing in restorative dentistry or dental prosthetics as evaluators. A limitation of our approach is that we did not control for specific experience in shade determination. Although this could introduce variability, we reasoned that restorative dentists would likely have heightened familiarity with shade selection because of their clinical experience. Nonetheless, we acknowledge that the absence of controls for differences in evaluators’ training and expertise could introduce potential biases, which should be considered in interpreting the findings.
This study underscores the subjective nature of visual colour assessments in dentistry, which is susceptible to various influences, including clinicians’ personal beliefs. Additional clinical studies involving natural tooth colour are imperative to validate our findings and ascertain their impact on restoration colour matching. In addition, as the study was conducted in a single setting, the results may not be fully generalizable to a broader population of dental professionals. It is also noteworthy that the time allocated for shade evaluation for each specimen was limited to about 5 s, as recommended by the Society for Colour and Appearance in Dentistry. However, clinicians often take longer to determine shade, which can lead to different results. Despite its limitations, the present study employed a robust and well-defined method for colour analysis, specifically by controlling illumination conditions and evaluation time. We also randomized the sequence of specimen evaluations to mitigate potential biases, such as those related to evaluator fatigue. Furthermore, the method used is reproducible, allowing for comparisons of our results with those of future studies.
Conclusions
This study found that blinding shade guide tabs did not affect the overall accuracy of colour determination. In addition, there was no difference in accuracy between undergraduate students and experienced dentists. However, unblinding the tabs significantly increased the selection of shades in the hue A category, regardless of evaluator experience. This indicates the presence of unconscious bias toward hue A shades among both undergraduate dental students and experienced dentists, highlighting an inherent tendency that persists even in highly trained professionals.
AUTHOR’S NOTE: In the CIELAB color system, the asterisks (*) in L*, a*, and b* denote that these values belong to the **CIE 1976 (L*a*b*) colour space, as defined by the Commission Internationale de l'Éclairage (CIE). They serve to distinguish these coordinates from those in earlier, less perceptually uniform colour models.
In the CIEDE2000 formula for calculating colour differences (ΔE00), the variables are unitless.
Conclusion
THE AUTHORS
 |
Ms. Vieira da Silva is an undergraduate student, School of Dentistry, Federal University of Sergipe, Brazil. |
 |
Ms. Alencar Rodrigues Rosa is an undergraduate student, School of Dentistry, Federal University of Sergipe, Brazil. |
 |
Dr. Barata de Mattos is a PhD candidate, graduate program in dentistry, Federal University of Sergipe, Brazil. |
 |
Dr. Carregosa Santana is a graduate student in dentistry, Federal University of Sergipe, Brazil. |
 |
Dr. Santana is a graduate student in dentistry, Federal University of Sergipe, Brazil. |
 |
Dr. Damasceno Silva is a graduate student in dentistry, Federal University of Sergipe, Brazil. |
 |
Dr. Faria-e-Silva is an associate clinical professor, Faculty of Dental Medicine, Laval University, Québec, Quebec. |
Corresponding author: André Luis Faria-e-Silva, Faculté de médecine dentaire, Université Laval, 2420, rue de la Terrasse, Québec QC G1V 0A6 Canada. E-mail: andre-luis.faria-e-silva@fmd.ulaval.ca
This article has been peer reviewed.
References
- La Rosa GRM, Pasquale S, Pedullà E, Palermo F, Rapisarda E, Gueli AM. Colorimetric study about the stratification’s effect on colour perception of resin composites. Odontology. 2020;108(3):479-85. doi: 10.1007/s10266-019-00469-9
- Ricci WA, Fahl Jr N. Nature-mimicking layering with composite resins through a bio-inspired analysis: 25 years of the polychromatic technique. J Esthet Restor Dent. 2023;35(1):7-18. doi: 10.1111/jerd.13021
- Samra APB, Moro MG, Mazur RF, Vieira S, De Souza EM, Freire A, et al. Performance of dental students in shade matching: impact of training. J Esthet Restor Dent. 2017;29(2):E24-32. doi: 10.1111/jerd.12287
- Hein S, Modrić D, Westland S, Tomeček M. Objective shade matching, communication, and reproduction by combining dental photography and numeric shade quantification. J Esthet Restor Dent. 2021;33(1):107-17. doi: 10.1111/jerd.12641
- Paravina RD, Powers JM, Fay RM. Dental color standards: shade tab arrangement. J Esthet Restor Dent. 2001;13(4):254-63. doi: 10.1111/j.1708-8240.2001.tb00271.x
- Elamin HO, Abubakr NH, Ibrahim YE. Identifying the tooth shade in group of patients using Vita Easyshade. Eur J Dent. 2015;9(2):213-7. doi: 10.4103/1305-7456.156828
- Browning WD, Contreras-Bulnes R, Brackett MG, Brackett WW. Color differences: polymerized composite and corresponding Vitapan Classical shade tab. J Dent. 2009;37 Suppl 1:e34-9. doi: 10.1016/j.jdent.2009.05.008
- Liberato WF, de Almeida EN, Gallito MA, Faria-e-Silva AL, Schneider LFJ, Cavalcante LMA. Influence of a gray background and the illuminant on tooth shade selection. J Prosthet Dent. 2024 15:S0022-3913(23)00824-7. doi: 10.1016/j.prosdent.2023.12.005
- Tabatabaian F, Beyabanaki E, Alirezaei P, Epakchi S. Visual and digital tooth shade selection methods, related effective factors and conditions, and their accuracy and precision: a literature review. J Esthet Restor Dent. 2021 Dec;33(8):1084-104. doi: 10.1111/jerd.12816
- Haddad HJ, Jakstat HA, Arnetzl G, Borbely J, Vichi A, Dumfahrt H, et al. Does gender and experience influence shade matching quality? J Dent. 2009;37 Suppl 1:e40-4. doi: 0.1016/j.jdent.2009.05.012
- Ristic I, Stankovic S, Paravina RD. Influence of color education and training on shade matching skills. J Esthet Restor Dent. 2016;28(5):287-94. doi: 10.1111/jerd.12209
- Clary JA, Ontiveros JC, Cron SG, Paravina RD. Influence of light source, polarization, education, and training on shade matching quality. J Prosthet Dent. 2016;116(1):91-7. doi: 10.1016/j.prosdent.2015.12.008
- Luo MR, Cui G, Rigg B. The development of the CIE 2000 colour‐difference formula: CIEDE2000. Color Res Appl. 2001;26(5):340-50. doi: 10.1002/col.1049
- Sharma G, Wu W, Dalal EN. The CIEDE2000 color-difference formula: implementation notes, supplementary test data, and mathematical observations. Color Res Appl. 2005;30(1):21-30. doi: 10.1002/col.20070
- Paravina RD, Ghinea R, Herrera LJ, Bona AD, Igiel C, Linninger M, et al. Color difference thresholds in dentistry. J Esthet Restor Dent. 2015;27 Suppl 1:S1-9. doi: 10.1111/jerd.12149
- Villarroel M, Fahl N, De Sousa AM, De Oliveira Jr OB. Direct esthetic restorations based on translucency and opacity of composite resins. J Esthet Restor Dent. 2011;23(2):73-87. doi: 10.1111/j.1708-8240.2010.00392.x
- Pecho OE, Pérez MM, Ghinea R, Della Bona A. Lightness, chroma and hue differences on visual shade matching. Dent Mater. 2016;32(11):1362-73. doi: 10.1016/j.dental.2016.08.218
- Davison SP, Myslinski NR. Shade selection by color vision-defective dental personnel. J Prosthet Dent. 1990;63(1):97-101. doi: 10.1016/0022-3913(90)90276-i
- Ahn JS, Lee YK. Color distribution of a shade guide in the value, chroma, and hue scale. J Prosthet Dent. 2008;100(1):18-28. doi: 10.1016/S0022-3913(08)60129-8
- Talboy A, Schneider S. Reference dependence in Bayesian reasoning: value selection bias, congruence effects, and response prompt sensitivity. Front Psychol. 2022;13:729285. doi: doi.org/10.3389/fpsyg.2022.729285
- Moore DA, Healy PJ. The trouble with overconfidence. Psychol Rev. 2008;115(2):502-17. doi: 10.1037/0033-295X.115.2.502