Abstract
Background: The spatial arrangement of primary health care (PHC) services is influenced by many factors and varies across provider types. In Canada, unlike physician services, certain PHC services (i.e., dentistry, physiotherapy) are not fully funded under the health care system. As a result, one might expect the arrangement of these services to differ by neighbourhood, even in dense metropolitan areas.
Objective: This study examines the intra-urban variability of geographic access to dental (DS) and physiotherapy (PT) services in relation to family physician (FP) services in an urban area and identifies underserviced neighbourhoods.
Methods: Practice location information was gathered from publicly available and routinely updated provincial sources (physician, physiotherapy and dentistry regulatory colleges). A neighbourhood accessibility score for all 3 PHC services was calculated using a GIS-based, 3-step floating catchment area method. A set of parameters, such as catchment type (road network buffer), size (3 km radius) and census centroids (dissemination areas), was used.
Results: The overall access scores for FP, PT and DS services (based on the 281 FPs, 226 PTs, and 152 DSs) were 1.45 (SD 0.94), 1.18 (SD 0.81) and 0.79 (SD 0.53) providers/1000 population, respectively. Spatial comparison of the accessibility scores indicated a greater proportion of the Saskatoon population has lower access scores (< 0.5/1000 population) for both physiotherapy (n = 79 450) and dental (n = 101 270) services compared with family physician services (n = 64 420). Exploration of the relation between PHC service arrangement and key sociodemographic variables (e.g. low income, education levels) showed that a considerable proportion of those in each sociodemographic group has poor PT and DS access.
Conclusion: This research has identified accessibility gaps and serves to inform the development of health policies focused on equitable distribution and funding of PHC services based on population health needs.
Inequitable access to health care exists in many urban settings and is a recognized challenge in the provision of health care delivery.1-3 In both developed and developing countries, a variety of primary and specialist health care services can be found in large urban settings. However, recent research has shown that the distribution of services in urban areas varies when poor sociodemographic conditions exist.4-6 For example, in Perth, Western Australia, “adult public dental clinics were unevenly distributed across the low urban dental index areas.”6 Developed countries with dispersed and low population densities are likely not only concerned about access to primary health care (PHC) resources across the full rural–urban spectrum, but also within the most diverse urban areas in terms of demographic, socioeconomic and ethnic composition.5,7 In Missouri and Wisconsin, United States, a considerable percentage of both rural and urban populations live in areas with a shortage of dental services.8
In Canada, the delivery and funding of health care varies across provinces and territories in many ways, including range and configuration of services, governance and funding models.9,10 The Canadian PHC model involves a broad range of health professionals (including but not limited to physicians, nurses, nurse practitioners, dietitians, physiotherapists, dentists, pharmacists and social workers), who provide first-contact services. A process of reform is underway and involves a variety of initiatives under consideration to address the challenge of providing health care resources.11
In Canada, certain PHC services are not fully funded under provincial health care systems. Thus, people pay privately for such services as dentistry, physiotherapy and optometry. In contrast, family physician services and hospital care are wholly publicly funded in all jurisdictions.12 Integration of the health workforce (including dental and physiotherapy services) into primary care is an emerging concept currently being debated to better understand potential barriers, particularly in the North Amercian context.13,14 Common barriers to the integration of oral and dental services into primary care include the absence of health care policies and supporting strategies, inadequate interdisciplinary training and workload increase.14 For example, physiotherapists are part of PHC teams in rural and specific urban programs in some jurisdictions (e.g., New Brunswick); however, the integration of physiotherapists into PHC “is affected by factors ranging from individual to system levels.”15 Approximately 52.2% and 44.6% of physiotherapists in Saskatchewan and Canada work in the public sector with the remaining 36.5% and 32.4% in the private sector, respectively.16 Currently, only 5% of oral health care is publicly financed in Canada, with the remaining 95% privately financed (51% from employee-based insurance, 44% from out of pocket payments).17
Access to PHC services is often described as a “degree of fit” between a provider and a patient, which is perceived to be influenced by 5 dimensions (availability, accessibility, acceptability, accommodation, affordability) that highlight the patient’s “ability or willingness to enter the health care market.”18 The first two dimensions (availability and accessibility) represent the geographic aspects of access. Reduced or limited access to dental and physiotherapy services can have negative public health implications. Recent evidence shows that those without dental insurance have more decayed teeth and fewer filled teeth and more frequently report oral pain and difficulty eating (indicators of oral disease).19 In addition, the concentration of dental professionals is sensitive to degree of urbanization.20 Physiotherapists help people regain physical function and movement following injury or disease, allowing them to return to healthy living, work and recreational activities.21-23 Being fully physically functional and active affects not only mental and physical health, but also capacity to participate in society and the economy and independence.24
Canada is similar to other industrialized countries in that 82.5% of the population live in urban areas.25 Equitable provision of health care delivery in urban areas is considered one of the challenges affecting population health. In Saskatoon, Saskatchewan, higher rates of mental disorders, diabetes, low birth weight, injuries, poisonings and coronary health disease have been reported in low-income neighbourhoods.26 In Montréal, Quebec, mental health services are not equally distributed in the southwestern districts and, as a consequence, accessibility scores vary widely from one area to another.27
Health care delivery in urban areas is sensitive to the relation between distribution of services and the populations they are meant to serve. Where residents must pay for services, such as dental care and physiotherapy, low-income or poor neighbourhoods could experience a shortage of providers. Thus, intra-urban access to a range of PHC services from different payment models is a relevant public health issue. This research investigates the extent to which access to dentists and physiotherapists differs from access to family physicians and identifies underserviced neighbourhoods in a mid-size Canadian city (Saskatoon) by applying a geospatial mapping approach.
Methods
We adopted an exploratory geospatial approach to examine patterns of geographic access to 3 health care provider types: dentists (DS), physiotherapists (PT) and family physicians (FP). This was done to compare urban neighbourhoods and to locate underserviced areas. We used data for census subdivisions in a mid-size Canadian Prairie city, Saskatoon, Saskatchewan. Information about family physicians was collected from the College of Physicians and Surgeons of Saskatchewan. Family physicians were identified as those clinically practising in non-hospital community settings in 2014. Information about family dentists was collected from the College of Dental Surgeons of Saskatchewan, and only dentists practising under the general practitioner’s category in 2014 were included. In the case of physiotherapists, data were obtained from 2013 membership renewal of the Saskatchewan College of Physical Therapists for members who were providing direct patient care in a community based setting (i.e., outside hospitals).
Health care providers’ postal address/postal code was used in an integrated geocoding approach to create a set of geographic coordinates.28,29 The road network layer (DMTI Spatial, Richmond Hill, Ont.) and multiple enhanced postal-code points were used as reference datasets in the geocoding process using ArcGIS software (ESRI, Redlands, Calif.). Practice locations, together with population data at the dissemination area (DA) level (i.e., health care demands), were used to calculate neighbourhood access scores.
A 3-step floating catchment area (3SFCA) method with a 3 km buffer catchment area29-31 was applied to estimate access scores for all 3 health care services separately. This method has been previously applied to health care services, food availability, and access to physical therapists and dentists.32-34 In the first step of this method, a provider-to-population ratio was calculated at the practice level. This was done by placing a 3-km buffer around each health care practice point to capture the points of population demand (DA centroids) within its catchment. Second, the ratios from all provider points within the 3-km buffer were summed. Third, the neighbourhood access ratio (score) was calculated by averaging the access ratios from all DAs (i.e., the result of the second step) in a neighbourhood.
We used a municipality-defined neighbourhood layer for Saskatoon.35 This study builds on a central concept in geography that the results of geographical studies can be influenced by the way areal units are defined/conceptualized.36-38 Although there are limitations,39-41 municipality-defined neighbourhoods are used in this study to address the issue of neighbourhood definition dealing with the geographic unit problem (i.e., “modifiable areal unit problem”), as well as its increasing importance and use in the planning and analysis of urban areas.42 Neighbourhood access scores, providing a local format for health care provider-to-1000 population ratio for each areal unit, are used for further analysis where smaller or no access scores indicate poor geographic accessibility to the health care services/providers.
For mapping purposes, access scores for all 3 health care provider types were dichotomized into 2 categories: low- and high-access categories where < 0.5 providers/1000 population is considered an indicator of a poorly served neighbourhood and ≥ 0.5 providers/1000 population is viewed as an indicator of a better-served population. Spatial comparison between the accessibility scores for PT and DS services relative to the FP services and cross-tabulation between the access scores for all 3 provider types in relation with the selected sociodemographic variables was performed to understand intra-urban variability better. For cross-tabulations of the access scores for the 3 health care services and between the access scores and sociodemographic variables, the access scores were divided into 4 classes: < 0.05, 0.5–1.0, 1.0–1.5 and > 1.5 providers/1000 population.
To explore the relation between access scores for all 3 health care services and selected sociodemographic variables, we used a set of 6 variables from the 2011 Canadian Census and the 2011 National Household Survey in our analyses: high health care need, immigrants (2001–2011), lone-parent families, Aboriginal identity, population without postsecondary education, low-income families (based on 2010 after-tax data). We selected these variables after reviewing a number of studies5,43-45 primarily in primary care contexts, although some of these variables may not directly relate to all 3 health care providers. In the analysis, these variables are used as a proxy for social determinants of health (aggregated at the neighbourhood level) and expressed as percentages where higher proportions of these variables generally demand high health care need.
Results
In estimating access scores, we included geospatial data from 281 family physicians, 226 physiotherapists and 152 general dentists in Saskatoon. Figure 1 shows the distribution of these health care services by practice size relative to the neighbourhood-level prevalence of low-income families.
We calculated a set of neighbourhood access scores for all 3 health care services that describes geographic aspects of access to these 3 services using the 3SFCA method. In all cases, a higher access score (providers/1000 people) represents better geographic access to PHC services.
City-level access scores for FP, PT and DS services based on 63 neighbourhoods were 1.45 (max. 3.96, standard deviation [SD 0.94), 1.18 (max. 2.94, SD 0.81) and 0.79 (max. 2.03, SD 0.53) providers/1000 population, respectively. The results of the cross-tabulations for provider access scores (PT versus FP, DS versus FP, and DS versus PT) are displayed in Table 1. A greater proportion of the Saskatoon population has lower access scores (< 0.5/1000 population) for both physiotherapy (n = 79 450) and dental (n = 101 270) services compared with family physician services (n = 64 420). A substantial portion of Saskatoon’s total population of 221 400 is located in the lowest-access category (< 0.5/1000 population) for both FP and PT (47 935), for FP and DS (64 420) and for PT and DS (74 940). These results are mapped in Fig. 2, where cross-classifications between dichotomized categories show low-low, low-high, high-low and high-high access scores by neighbourhood for each pair of providers as well as for all 3 services. In all 4 cases, most of the neighbourhoods with poor access are located close to the edge of the city.
| a. | Access score for family physician services | ||||
| Access score for physiotherapy services | < 0.5 | 0.5–1.0 | > 1.0–1.5 | > 1.5 | Total |
| < 0.5 | 47 935 | 27 715 | 3 800 | - | 79 450 |
| 0.5–1.0 | 10 140 | 6 295 | 11 455 | 25 065 | 52 955 |
| > 1.0–1.5 | 4 715 | - | 6 540 | 10 735 | 21 990 |
| > 1.5 | 1 630 | 2 820 | 9 730 | 52 865 | 67 045 |
| Total | 64 420 | 36 830 | 31 525 | 88 665 | 221 440 |
| b. | Access score for family physician services | ||||
| Access score for dental services | < 0.5 | 0.5–1.0 | > 1.0–1.5 | > 1.5 | Total |
| < 0.5 | 64 420 | 29 500 | 7 350 | - | 101 270 |
| 0.5–1.0 | - | 7 330 | 14 095 | 38 975 | 60 400 |
| > 1.0–1.5 | - | - | 10 080 | 30 310 | 40 390 |
| > 1.5 | - | - | - | 19 380 | 19 380 |
| Total | 64 420 | 36 830 | 31 525 | 88 665 | 221 440 |
| c. | Access score for physiotherapy services | ||||
| Access score for dental services | < 0.5 | 0.5–1.0 | > 1.0–1.5 | > 1.5 | Total |
| < 0.5 | 74 940 | 16 435 | 4 715 | 5 180 | 101 270 |
| 0.5–1.0 | 4 510 | 21 410 | 11 035 | 23 445 | 60 400 |
| > 1.0–1.5 | - | 15 110 | 5 390 | 19 890 | 40 390 |
| > 1.5 | - | - | 850 | 18 530 | 19 380 |
| Total | 79 450 | 52 955 | 21 990 | 67 045 | 221 440 |
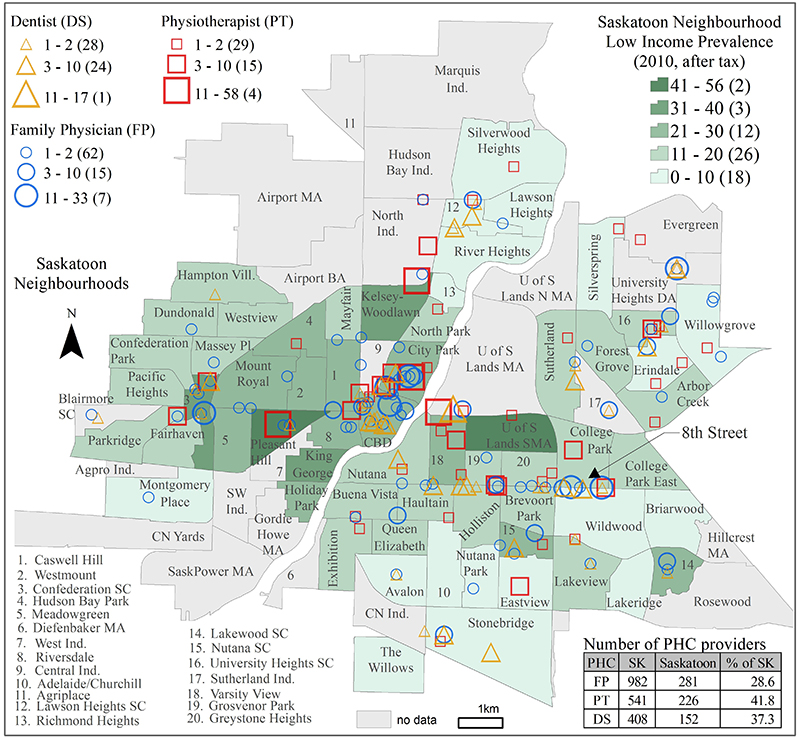
Figure 1: Prevalence of low-income families by neighbourhood in Saskatoon, Saskatchewan, based on 2010 after-tax income overlaid by location of family physicians, physiotherapists and dentists for 3 practice sizes. Note: BA = Business Area, CN. Ind. = Canadian National Railway Industrial, MA = Management Area, SC = Suburban Centre, SW Ind. = Southwest Industrial, U of S = University of Saskatchewan, DA = Development Area.
| Proportion of the population, % | |||||||
| Access score | Provider | High health care needs* (n = 91 040) |
Immigrants, 2001–2011 (n = 14 650) |
Single-parent families (n = 10 395) |
Aboriginal identity (n = 21 195) |
No postsecondary education (n = 80 215) |
Low income (n = 30 385) |
| *High health care needs is a composite variable made up of population under 4, female population 18–49 and population > 65 years of age. | |||||||
| < 0.5 | FP | 28.2 | 31.1 | 27.6 | 27 | 29.6 | 20.4 |
| PT | 33.9 | 38.2 | 32.3 | 31.6 | 34.6 | 28.3 | |
| DS | 43.6 | 50.6 | 42 | 39.8 | 44.2 | 33.9 | |
| 0.5–1.0 | FP | 16.2 | 20.5 | 13.6 | 11.5 | 14.8 | 16.1 |
| PT | 24.6 | 27.7 | 23.1 | 18.7 | 24 | 21.3 | |
| DS | 28.7 | 20.4 | 28.4 | 30.7 | 28.2 | 34.4 | |
| > 1.0–1.5 | FP | 15.3 | 11.9 | 13.8 | 19.3 | 14.9 | 17.6 |
| PT | 9.8 | 9 | 8.1 | 10.1 | 9.1 | 11.2 | |
| DS | 19 | 23.4 | 19.7 | 20.6 | 18.6 | 23.3 | |
| > 1.5 | FP | 40.3 | 36.6 | 45.1 | 42.1 | 40.7 | 46 |
| PT | 31.6 | 25.1 | 36.5 | 39.6 | 32.3 | 39.2 | |
| DS | 8.7 | 5.7 | 9.9 | 8.8 | 9 | 8.5 | |
We explored the relation between access scores for all 3 health care provider types and the selected sociodemographic factors (Table 2 and Fig. 3). We calculated the percentage of those in a sociodemographic group across 4 categories of access scores for each health care service (Table 2). Comparing the poorly served categories (< 0.50 providers/1000 population) for PT and DS services in relation to FP services showed that a considerable proportion of those in each sociodemographic group has poor PT and DS access. For example, of the 80 215 people age 15 years and over without postsecondary education, greater proportions of the population have poor geographic access to PT (34.6%) and DS (44.2%) services compared with FP services (29.6%).
We mapped Saskatoon neighbourhood access scores for all 3 health care services (Figs. 3a to 3c) as well as the distribution of the 6 sociodemographic variables (Figs 3d to 3i). A standard deviation (SD) scheme was used, where class breaks are placed above and below the mean at an interval of 1 SD until all data values are contained within the classes. In the map legend, each class that shows how much a value varies from the mean also presents data ranges and neighbourhood count. For example, 22 neighbourhoods (ranges 14.2 to 23.5% lone-parent families) falls in the middle class (± 0.5 SD). The first 2 classes and the last 2 classes represent the neighbourhoods with comparatively lower and higher proportions of lone-parent families, respectively.

Figure 2: Comparison of neighbourhood access scores between (a) family physician (FP) and physiotherapist (PT) services, (b) FP and dental services (DS), (c) PT and DS, and (d) FP, PT, and DS. In all cases, low = access score < 0.5 providers per 1000 population and high = access score ≥ 0.5 providers per 1000 population.

Figure 3: Saskatoon neighbourhoods showing: (a to c) the distribution of 3-step floating catchment area accessibility scores for family practitioners (FP), physiotherapy (PT) and dental (DS) services; (d to i) manually classified and sociodemographic characteristics, classified using standard deviation scheme.
Discussion and Conclusions
In comparing geographic access to DS, PT and FP services in Saskatoon, we found inequalities in the distribution of these services showing that dentists and physiotherapists are more highly concentrated in certain areas of the city. For example, service concentrations can be seen in the urban centre and along a commercial corridor (8th Street) on the east side of the city (see Fig. 1).
The second part of this study compared measures of poor access with various sociodemographic variables: high health care needs, immigrants (2001–2011), lone-parent families, aboriginal identity, no postsecondary education and low-income. Our results show most of the neighbourhoods with poor access to PHC services are located close to the outer margins of the city. One possible reason for this pattern could be that city population growth has outpaced provision of health care services. According to recent population statistics, the city of Saskatoon population growth rate between 2001 and 2015 was 32 per cent — faster than other similar urban areas with population less than 500,000 across Canada.46 Although it is beyond the scope this study to explain the possible factors reducing the availability of health care resources in detail, existing models suggest that factors such as income and education are associated with health care access and use.47-49
There are a few limitations related to the data and methods used in this study. The process of estimating geographic access depends on 3 factors: the level and type of input data; the spatial interaction processes involved; and units of analysis. Commonly, 2 kinds of input data are required for the GIS-based accessibility method: supply (i.e., health care services) and demand (population health care needs). In our research, practice location information (health care supply data) was gathered from publicly available and routinely updated sources. Information about the 3 health care professions comes from different sources and sociodemographic variables and population figures based on the 2011 Census are not from the same year/period, which may slightly skew the results and complicate interpretation. Also, the DA centroids and locations of health care services may be subject to positional errors because of the techniques generally applied to create a set of geographic coordinates. Among GIS-based accessibility measures, particularly in the field of health services research using floating catchment area (FCA) method has opened a new section of geographic research describing methodological developments/ improvements. In an assessment of recent improvements of 2SFCA method, McGrail50 specified that a “key strength of the 2SFCA method is that it can be readily applied to both metropolitan and rural populations. However, this ‘flexibility’ can also be one of its weaknesses when applied simultaneously across all geographies.” Among many newly developed methods based on the FCA approach, the current research uses an improvement to FCA method31,32 that was tested and applied mostly in urban context.
The findings of this study show that dentists and physiotherapists relative to family physicians are inequitably distributed within Saskatoon, SK Canada in relation to key sociodemographic variables. Similar patterns of inequitable access may also be present in other communities; however, further research is needed to confirm such an hypothesis. The methods and approach used in this study to determine the spatial distribution of services may serve as a model to further examine this issue. Ideally, health care accessibility should be examined in urban areas on a regular basis to observe changes in poorly served areas, distributions of health services, and relationships with population health care needs. This information could then be shared with health care professionals and relevant policy makers and professional associations (family physicians, physiotherapists, and dentists); particularly for those who are looking to start new practices, those who are in training/newly graduated, or those who wish to change their practice location. Combining GIS and spatial analysis tools provide the power of looking beyond the simple intra-urban organization of PHC services in particular about the distribution of the population health characteristics. Ultimately this type of approach will contribute to the development of health policies focused on equitable distribution and funding of PHC services based on population health need.
THE AUTHORS
 |
Dr. Shah is a postdoctoral research fellow, School of Physical Therapy, University of Saskatchewan. |
 |
Dr. Bath is an associate professor, School of Rehabilitation Science, University of Saskatchewan. |
 |
Dr. Hayes is an assistant professor, Dental Public Health, College of Dentistry, University of Saskatchewan. |
 |
Ms. Jones is a student, College of Dentistry, University of Saskatchewan. |
 |
Dr. Bell is a professor, Geography and Planning, University of Saskatchewan; Visiting Scholar, Center for Geographic Analysis, Harvard University. |
 |
Dr. Uswak is past-dean and associate professor, College of Dentistry, University of Saskatchewan. |
 |
Dr. Milosavljevic is a professor, School of Rehabilitation Science, University of Saskatchewan. |

Acknowledgement: Funding: Saskatchewan Health Research Foundation (SHRF) and College of Medicine, University of Saskatchewan.
Correspondence to: Dr. Brenna Bath, University of Saskatchewan, 104 Clinic Place, Health Sciences E-Wing, CCSA Room 1340, Saskatoon, SK S7N 2Z4. Email: brenna.bath@usask.ca
The authors have no declared financial interests.
This article has been peer reviewed.
References
- Garcia E, Serban N, Swann J, Fitzpatrick A. The effect of geographic access on severe health outcomes for pediatric asthma. J Allergy Clin Immunol. 2015;136(3):610-8.
- Sanders LJ, Aguilar GD, Bacon CJ. A spatial analysis of the geographic distribution of musculoskeletal and general practice healthcare clinics in Auckland, New Zealand. Appl Geogr. 2013;44:69-78. doi: 10.1016/j.apgeog.2013.07.014
- Collins PA, Hayes MV. The role of urban municipal governments in reducing health inequities: a meta-narrative mapping analysis. Int J Equity Health. 2010;9:1-20. doi: 10.1186/1475-9276-9-13
- Harrington DW, Rosenberg MW, Wilson K. Comparing health status and access to health care in Canada’s largest metropolitan areas. Urban Geogr. 2014;35(8):1156-70. doi: 10.1080/02723638.2014.945262
- Ahmad A, Quiñonez C. Disparities in the availability of dental care in metropolitan Toronto. J Can Dent Assoc. 2014;80:e3.
- Coles E, Kruger E, Anjrini AA, Tennant M. The urban dental index: a method for measuring and mapping dental health disparities across urban areas. J Urban Health. 2017;94(2):211-9.
- Vlahov D, Freudenberg N, Proietti F, Ompad D, Quinn A, Nandi V, et al. Urban as a determinant of health. J Urban Health. 2007;84(3 suppl):16-26.
- Nasseh K, Eisenberg Y, Vujicic M. Geographic access to dental care varies in Missouri and Wisconsin. J Public Health Dent. 2017;77(3):197-206.
- Allin S, Rudoler D. The Canadian health care system, 2014. In: Mossialos E, Wenzl M, Osborn R, Anderson C (editors). International profiles of health care systems. New York: Commonwealth Fund; 2015.
- Healthcare governance models in Canada: a provincial perspective. Toronto: Institute of Public Administration of Canada, MNP, and Fasken Martineau; 2013.
- Improving primary health care through collaboration: briefing 1 — current knowledge about interprofessional teams in Canada. Ottawa: Conference Board of Canada; 2012.
- Canada’s health care system. Ottawa: Health Canada; 2012.
- Emami E, Harnagea H, Girard F, Charbonneau A, Voyer R, Bedos CP, et al. Integration of oral health into primary care: a scoping review protocol. BMJ Open. 2016;6(10):e013807.
- Harnagea H, Couturier Y, Shrivastava R, Girard F, Lamothe L, Bedos CP, et al. Barriers and facilitators in the integration of oral health into primary care: a scoping review. BMJ Open. 2017;7(9):e016078.
- Maharaj S, Chung C, Dhugge I, Gayevski M, Muradyan A, McLeod KE, et al. Integrating physiotherapists into primary health care organizations: the physiotherapists’ perspective. Physiother Can. 2018;70(2):188-95.
- Physiotherapists, 2014: highlights 5-year trends in the physiotherapist supply and workforce across a variety of demographic, education and employment characteristics. Ottawa: Canadian Institute for Health Information; 2015.
- Quiñonez C. Why was dental care excluded from Canadian Medicare? Working papers series. Nova Scotia: Network for Canadian Oral Health Research; 2013.
- Penchansky R, Thomas JW. The concept of access: definition and relationship to consumer satisfaction. Med Care. 1981;19(2):127-40.
- Improving access to oral health care for vulnerable people living in Canada. Ottawa: Canadian Academy of Health Sciences; 2014.
- Emami E, Khiyani MF, Habra CP, Chassé V, Rompré PH. Mapping Quebec dental workforce: ranking rural oral health disparities. Rural Remote Health. 2016;16(1):3630.
- What is physiotherapy. Saskatoon: Saskatchewan Physiotherapy Association; 2015.
- Bath B. Inclusion and integration of physiotherapists in primary health care models in Saskatchewan: a resource paper prepared for the Saskatchewan Physiotherapy Association’s government relations committee. Saskatoon: University of Saskatchewan; 2012.
- Primary health care: a resource guide for physical therapists. Edmonton: College of Physical Therapists of Alberta; 2007. 978-0-9687043-6-3.
- Barnes S, Dolan LA, Gardner B, Stevens M, Zack E. Equitable access to rehabilitation: Realizing potential, promising practices, and policy directions. Toronto: Canadian Working Group on HIV and Rehabilitation (CWGHR) and Wellesley Institute; 2012.
- Worldometers. Canada population (live). London: Dadax Worldometers; 2019. Accessed 2019 Feb 26. Available from: http://www.worldometers.info/world-population/canada-population/
- Lemstra M, Neudorf C, Opondo J. Health disparity by neighbourhood income. Can J Public Health. 2006;97(6):435-9.
- Ngamini Ngui A, Vanasse A. Assessing spatial accessibility to mental health facilities in an urban environment. Spat Spatiotemporal Epidemiol. 2012;3(3):195-203.
- Shah TI, Bell S, Wilson K. Geocoding for public health research: empirical comparison of two geocoding services applied to Canadian cities. Can Geogr. 2014;58(4):400-417. 10.1111/cag.12091
- Bissonnette L, Wilson K, Bell S, Shah TI. Neighbourhoods and potential access to health care: the role of spatial and aspatial factors. Health Place. 2012;18(4):841-53.
- Luo W. Using a GIS-based floating catchment method to assess areas with shortage of physicians. Health Place. 2004;10(1):1-11.
- Bell S, Wilson K, Bissonette L, Shah T. Access to primary health care: does neighbourhood of residence matter? Ann Assoc Am Geogr. 2013;103(1):85-105. doi: 10.1080/00045608.2012.685050
- Shah TI, Bath B, Milosavljevic S. Comparing geographical distribution of community-based physiotherapists and family physicians across Saskatchewan. Can Geogr. 2015;58(4). doi: 10.1111/cag.12224
- Shah TI, Bell S. Exploring the intra-urban variations in the relationship among geographic accessibility to PHC services and socio-demographic factors. Orlando, Fla.: HealthGIS 2013: Proceedings of the Second ACM SIGSPATIAL International Workshop on the Use of GIS in Public Health; 2013.
- Engler-Stringer R, Shah T, Bell S, Muhajarine N. Geographic access to healthy and unhealthy food sources for children in neighbourhoods and from elementary schools in a mid-sized Canadian city. Spat Spatiotemporal Epidemiol. 2014;11:23-32.
- Neighbourhood Planning Section: year-end report 2013. Saskatoon, Sask.: City of Saskatoon; 2014.
- Openshaw S. The modifiable areal unit problem. Norwich, UK: Geo Books; 1983.
- Flowerdew R, Manley DJ, Sabel CE. Neighbourhood effects on health: does it matter where you draw the boundaries? Soc Sci Med. 2008;66(6):1241-55.
- Haynes R, Daras K, Reading R, Jones A. Modifiable neighbourhood units, zone design and residents’ perceptions. Health Place. 2007;13(4):812-25.
- Kwan MP. The uncertain geographic context problem. Ann Assoc Am Geogr. 2012;102(5):958-68. doi: 10.1080/00045608.2012.687349
- Bell S, Shah TI, Wilson K. Neighbourhood models to identify MAUP effects using spatial regression. Presented at ESRI Health GIS conference2011, Arlington, Virginia. Saskatoon: University of Saskatchewan; 2011.
- Ross NA, Tremblay SS, Graham K. Neighbourhood influences on health in Montréal, Canada. Soc Sci Med. 2004;59(7):1485-94.
- Guest AM, Lee BA. How urbanites define their neighborhoods. Popul Environ. 1984;7(1):32-56.
- Wang F, Luo W. Assessing spatial and nonspatial factors for healthcare access: towards an integrated approach to defining health professional shortage areas. Health Place. 2005;11(2):131-46.
- Pampalon R, Hamel D, Gamache P, Philibert MD, Raymond G, Simpson A. An area-based material and social deprivation index for public health in Québec and Canada. Can J Public Health. 2012;103(8 suppl):S17-22.
- Asanin J, Wilson K. “I spent nine years looking for a doctor”: exploring access to health care among immigrants in Mississauga, Ontario, Canada. Soc Sci Med. 2008;66(6):1271-83.
- Tassonyi A. The context and challenges for Canada’ mid-sized cities. A briefing paper. Calgary: AB The School of Public Policy; 2017. Accessed 2019 Feb 26. Available from:https://www.policyschool.ca/wp-content/uploads/2017/05/Mid-Sized-Cities…
- Aday LA, Andersen R. A framework for the study of access to medical care. Health Serv Res. 1974;9(3):208-20.
- Andersen RM, McCutcheon A, Aday LA, Chiu GY, Bell R. Exploring dimensions of access to medical care. Health Serv Res. 1983;18(1):49-74.
- Babitsch B, Gohl D, von Lengerke T. Re-revisiting Andersen’s behavioral model of health services use: a systematic review of studies from 1998-2011. Psychosoc Med. 2012;9:Doc 11.
- McGrail MR. Spatial accessibility of primary health care utilising the two step floating catchment area method: an assessment of recent improvements. Int J Health Geogr. 2012;11:50.