Abstract
The COVID-19 pandemic has resulted in amended regulations and guidelines governing the practice of dentistry and dental hygiene to ensure the protection of both patients and clinicians from transmission of the SARS-CoV-2 virus. These guidelines include changes in personal protective equipment and, under some guidelines, the institution of a fallow period after any aerosol-generating procedure (AGP). This study aimed to investigate the effect of both ventilation and 4-handed dentistry in clinical practice with patients undergoing supportive periodontal therapy (SPT) by air polishing, ultrasonic and hand instrumentation in a closed operatory. We studied 34 patients during SPT using either 2- or 4-handed dentistry in an operatory with either 0 or 20 additional air changes/h (ACH). Under clinical conditions, 20 additional ACH are adequate to eliminate aerosols produced during an SPT and before the cessation of the AGP. The presence of an assistant had no significant effect on the time needed for aerosol particles to return to baseline values following the AGP. This study supports the efficacy of 20 additional ACH during the process of AGP, but does not support the need for an extended fallow period or 4-handed dentistry to provide additional high-volume evacuation throughout the procedure.
A global suspension of the practice of dentistry occurred when the COVID-19 pandemic was declared in March 2020. National governing bodies amended guidelines governing dentistry to ensure the protection of both patients and practitioners from the transmission of the SARS-CoV-2 virus, specifically following aerosol-generating procedures (AGPs). Most routine dental treatments produce a mixture of splatter, droplets and aerosol. Each of these can be contaminated with pathogens, such as bacteria or viruses, including SARS-CoV-2, as saliva has been identified as a possible reservoir of this virus.1-3 Because of their small size, dental aerosols have a low settling velocity and remain suspended in the air before settling on surfaces.4 For this reason, many governing bodies have introduced a fallow time — the time required for splatter, droplets and aerosols to settle on surfaces before being removed through chemical disinfection.
Air changes are a function of airflow (either naturally or mechanically stimulated) in a room, divided by the volume of the room.5 Increasing the number of additional air changes/h (ACH) in a closed room reduces the time needed to eliminate contaminants generated during AGPs.5 Canadian recommendations for a fallow time after an AGP are adapted from the Centers for Disease Control and Prevention (CDC) Guidelines for Environmental Infection Control in Health-Care Facilities.6 According to these guidelines, a room with 6 additional ACH requires 69 min for the removal or settling of 99.9% of aerosols.7 A room with 20 additional ACH requires 21 min for the removal or settling of 99.9% of aerosols.7 Research has found that in closed dental operatories with 6 additional ACH following 10 min of AGP on a simulated patient, most dental aerosol contamination of surfaces happens in the first 10 min post-procedure8-10 with no contamination 30–60 min post-AGP.11
Recent studies point to dental suction and evacuation as having a substantial effect in reducing contamination during AGPs12 with a low threshold of benefit between low- and medium-volume suction.8 Results of a systematic review point to the efficiency of high-volume evacuation (HVE) in the capture and removal of aerosols within 30 cm of the source (i.e., the patient’s mouth); however, this efficiency may be limited over longer distances from the source.13 Four-handed dentistry, with the help of an assistant to manually stabilize and direct the HVE tip, has also been shown to reduce contamination from aerosols and splatter.14
This study aimed to investigate the effect of ventilation and 4-handed dentistry in periodontal patients undergoing supportive periodontal therapy (SPT) in a closed operatory in a specialty clinic. The purpose was to quantify the fallow period following cessation of aerosol generation during a typical appointment. We hypothesized that the fallow period would be reduced with the use of additional ACH and with 4-handed dentistry. Second, we aimed to determine the aerosol concentration during an appointment using AGPs at both the mask level of the primary operator and 1 m from the AGP source. We hypothesized that the quantity of aerosol generated at either location would be reduced with the use of additional ACH and with the support of an assistant.
Methods
We studied 34 patients undergoing SPT in a private periodontal wellness and implant surgery clinic (Fonthill, Ont.) between September and November 2020. All procedures were performed by a single registered dental hygienist on patients with a diagnosis of unstable periodontitis.15 All clinical procedures were conducted strictly in accordance with all relevant guidelines and regulations in the province of Ontario.
Appointments were randomized to be completed by the hygienist as a solo operator or as the primary operator with a dental assistant as a secondary operator. All appointments were performed in the same enclosed operatory measuring 3.35 m x 3.05 m x 3.05 m with a heating, ventilation and air conditioning (HVAC) system (Lancaster Heating & Cooling, Hamilton, Ont.). Appointments were randomly chosen to have 0 or 20 additional ACH during the appointment. The number of ACH was verified by an independent HVAC specialist.
SPT was performed in the following sequence: probing and tissue check; disclosing solution (2Tone, Young, Mo., USA); motivation and oral hygiene instruction; air polishing using guided biofilm therapy (EMS Airflow Master Prophylaxis, Electro Medical Systems, Nyon, Switzerland); piezo-electric scaling (Electro Medical Systems); hand scaling; final check. Air polishing by guided biofilm therapy was conducted using erythritol powder with a granule size of 14 µm.
For AGPs performed by a solo operator, the hygienist used HVE-Purevac (evacuation rate [ER] 2.14 L/min, 12-mm bore diameter; Dentsply-Sirona, NY, USA), HVE with an extender (ER 0.83 L/min, 11.7-cm bore diameter; ReLeaf, Ivory, Kulzer, IN, USA) and a saliva ejector (ER 0.97 L/min, 3.5-mm bore diameter; Crosstex Int., NY, USA) for the capture of aerosols. The hygienist held the HVE-Purevac in the non-dominant hand and the HVE with an extender and saliva ejector were mounted stationary in place.
With assistance from a dental hygiene assistant, the hygienist used HVE-Purevac (ER 2.14 L/min, 12-mm bore diameter) with the non-dominant hand. The dental assistant used vented HVE-traditional (ER 4.5 L/min, 10-mm bore diameter; Henry Schein, NY, USA) and a saliva ejector to capture aerosols. All aspects of the appointment were timed by a research assistant.
Airborne particles were quantified before, during and after the procedure using DustTrak DRX Aerosol Monitors 8533 (TSI Incorporated, Shoreview, Minn., USA). The particle counters had a particle size range of 0.1–15 µm and a flow rate of 3.0 L/min. The aerosol concentration range of the particle counters was 0.001–150 mg/m3. One particle counter was located 1 m from the head of the dental chair to measure the ambient aerosol concentration (Figure 1a). A second was attached to a 0.91-m hose. The end of the hose was positioned at the shoulder of the primary operator (Figure 1b) and captured the aerosols generated at the mask level of the hygienist.
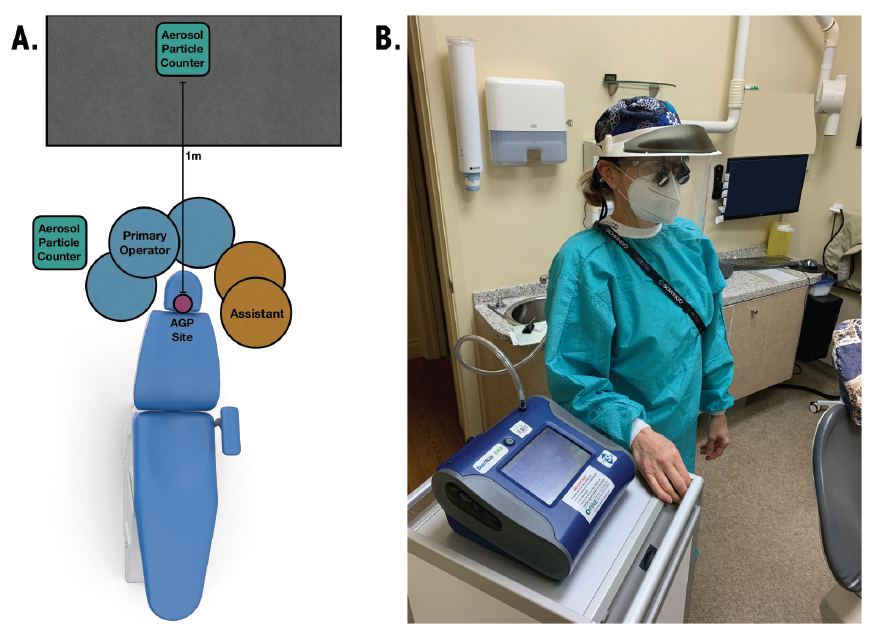
Figure 1: Representative operatory layout. (A) Room orientation showing positions of particle counter, hygienist, and assistant in relation to the site of aerosol generation. (B) Mask-level particle counter set-up. The operator is tethered at mask level to a 0.91-m hose connected to the particle counter.
All data were processed using MATLAB programming language (MathWorks, Natick, Mass., USA). Baseline and threshold values were determined and applied to every set of data.
The appointment was considered to be the full length of time the individual was in the operatory. The start and end of the AGP were considered the start of the air polishing and the end of Piezo-electric scaling, respectively. The peak of the AGP was determined as the maximum value of aerosol between the start and the end of the AGP (Figure 2).
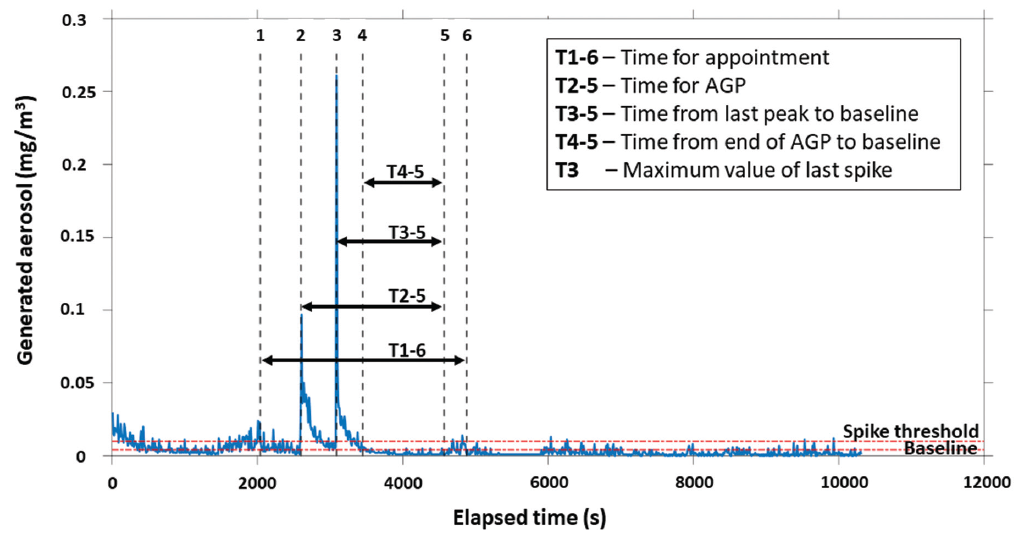
Figure 2: Timeline showing aerosol levels during a representative aerosol-generating procedure (AGP).
For each appointment, 4 values were quantified:
- Sum of the aerosol generated for all particle sizes between the start and end of the appointment
- Sum of the aerosol generated for all particle sizes during the AGP
- Peak aerosol generated for all particle sizes during the AGP
- Time from the end of the AGP to a return to baseline values
Statistical Analysis
A linear model using the assistant and ventilation factors as the independent variables was created for each of the 4 variables. The Q-Q plot of the residuals and the residuals vs. fitted values plots were used to determine normality and homogeneity of variance, respectively. The determination of normality was performed using the Shapiro-Wilk test, and homogeneity of variance determination was performed with Levene’s test. The 4 dependent variables were determined to be non-normal and, as such, were transformed to improve normality to allow use of a 2-way ANOVA. An inverse transformation was applied to the normalized sum over the appointment and the normalized sum over the AGP. A log10 transformation was applied to the maximum value of the last spike. A 2-way ANOVA was conducted on the transformed data to determine the effect of using an assistant, ventilation, and the interaction between assistant and ventilation. Time to baseline after AGP was grouped separately based on ventilation and assistant; where baseline was reached before the end of the AGP, this time was set to 0. However, because of these 0 values, time to baseline after the end of AGP could not be transformed, and the non-parametric Kruskal-Wallis test was used to compare the groups separately. Significance was set at α = 0.05, and significance identified in the 2-way ANOVA was verified using Tukey’s post-hoc test. All statistical analyses were performed in RStudio (v. 4.0.3). All results are described as mean ± standard deviation (SD).
Results
The final analysis included 34 data points (Figure 3). The average number of teeth (including dental implants) per individual was 26.8 ± 2.65. The average appointment time was 53.9 ± 10.1 min, and the average time spent conducting AGPs was 21.0 ± 5.9 min. The average time spent conducting AGP (both air polishing and ultrasonic scaling) per tooth was 47 ± 14 s.
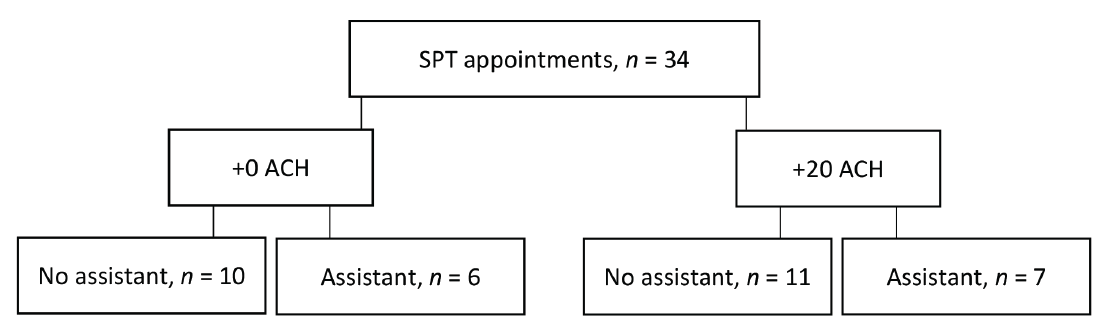
Figure 3: Study design: 34 supportive periodontal therapy (SPT) appointments were randomized to be completed with 0 or 20 additional air changes/h (+0 ACH or +20 ACH), with or without an assistant.
For the primary outcome — time to return to baseline values after the cessation of AGP — additional ACH had a significant effect at 1 m from the dental chair (p < 0.05) (Figure 4). Additional ACH reduced the time to return to baseline to 0 min with and without the presence of an assistant. Without additional ACH, the time to return to baseline was 2.3 ± 4.1 min with an assistant and 2.7 ± 5.0 min without an assistant. The presence of an assistant had no significant effect on the time for aerosol particles to return to baseline levels following AGP at 1 m from the AGP site.
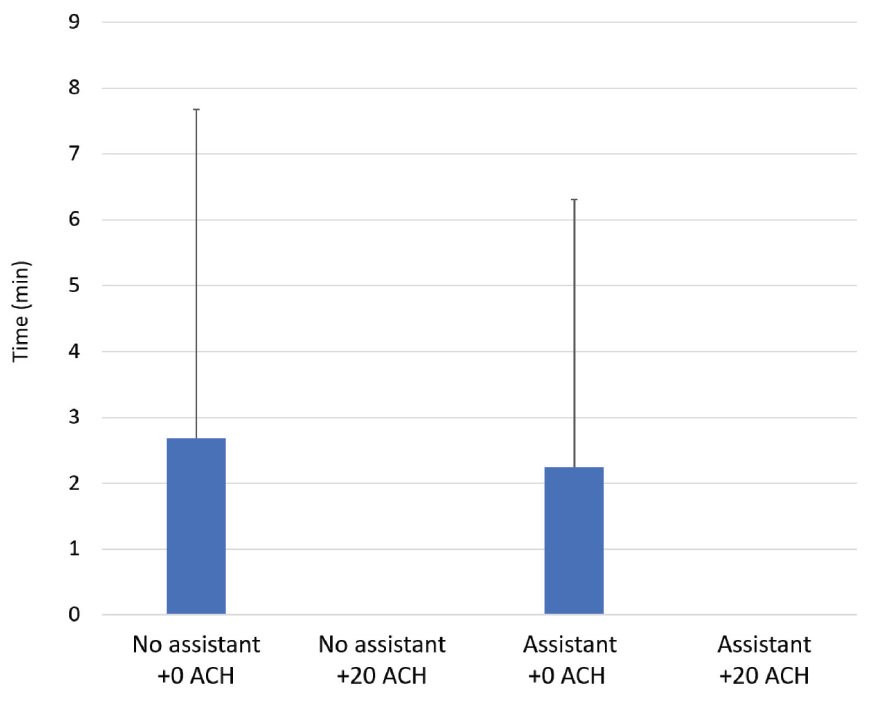
Figure 4: Average time from cessation of aerosol-generating procedure to return to baseline aerosol levels with 0 or 20 additional air changes/h (+0 ACH or +20 ACH), with or without an assistant.
At the mask level of the primary operator, peak aerosol generated was significantly influenced by the combination of the presence of an assistant and additional ACH at all particle sizes (Table 1). However, at 1 m from the AGP site, only the presence of an assistant caused a significant increase in the peak aerosol generated for all particle sizes (Table 1).
|
|
Particle size, µm |
+0 ACH |
+20 ACH |
Statistical analyses (p value by factor) |
||||
|---|---|---|---|---|---|---|---|---|
|
No assistant |
Assistant |
No assistant |
Assistant |
Assistant |
ACH |
Assistant by ACH |
||
|
Data were subjected to 2-way ANOVA with a significance level of p < 0.05; significant effects are noted in bold for each variable. The data in this table are the descriptive statistics and are not transformed. The statistical analyses were performed on transformed data. |
||||||||
| Mask level | ||||||||
| Peak aerosol,mg/m3 | 2.5 | 0.122 (0.243) | 0.710 (1.459) | 0.286 (0.491) | 0.021 (0.010) | 0.330 | 0.976 | 0.002 |
| Average | 0.122 (0.233) | 0.718 (1.370) | 0.288 (0.476) | 0.021 (0.009) | ||||
| Normalized sum over AGP, mg/m3/min | 2.5 | 0.028 (0.012) | 0.096 (0.114) | 0.064 (0.040) | 0.021 (0.012) | 0.123 | 0.535 | <0.001 |
| Average | 0.028 (0.019) | 0.097 (0.107) | 0.064 (0.034) | 0.021 (0.012) | ||||
| Ambient level | ||||||||
| Time to baseline, min | 2.7 (5.0) | 2.3 (4.1) | 0 (± 0) | 0 (0) | 0.613 | 0.005 | ||
| Peak aerosol, mg/m3 | 2.5 | 0.143 (0.146) | 0.418 (0.257) | 0.144 (0.177) | 0.641 (0.980) | 0.025 | 0.327 | 0.590 |
| Average | 0.203 (0.193) | 0.658 (0.433) | 0.236 (0.314) | 0.840 (1.215) | ||||
| Normalized sum over AGP, mg/m3/min | 2.5 | 0.057 (0.034) | 0.100 (0.038) | 0.065 (0.023) | 0.072 (0.068) | 0.385 | 0.812 | 0.018 |
| Average | 0.079 (0.057) | 0.143 (0.087) | 0.087 (0.047) | 0.093 (0.079) | ||||
| Normalized sum over appointment, mg/m3/min | 2.5 | 0.041 (0.019) | 0.060 (0.023) | 0.054 (0.042) | 0.048 (0.029) | 0.478 | 0.907 | 0.081 |
| Average | 0.055 (0.024) | 0.083 (0.033) | 0.073 (0.063) | 0.65 (0.037) | ||||
When normalized over the full appointment time, no effect was produced by the presence of an assistant, additional ACH or their combination on the sum of aerosol particles at 1 m from the site of AGP (Table 1). When normalized over the AGP, a significant effect resulted from the combination of the presence of an assistant and additional ACH on the sum of particle sizes 1, 2.5, 4 and 10 µm, but not > 10 µm at 1 m from the site of AGP (Suppl. Tables 1 and 2). No difference was observed between the normalized sum of aerosol particles over the AGP at the mask level of the primary operator (Table 1).
|
Mask Level |
Particle size, µm |
+0 ACH |
+20 ACH |
Statistical analyses (p value by factor) |
||||
|---|---|---|---|---|---|---|---|---|
|
No assistant |
Assistant |
No assistant |
Assistant |
Assistant |
ACH |
Assistant by ACH |
||
|
Data were subjected to 2-way ANOVA with a significance level of p < 0.05; significant effects are noted in bold for each variable. The data in this table are the descriptive statistics and are not transformed. The statistical analyses were performed on transformed data. |
||||||||
| Peak aerosol, mg/m3 | 1 | 0.119 (0.239) | 0.705 (1.451) | 0.283 (0.489) | 0.020 (0.010) | 0.331 | 0.967 | 0.002 |
| 2.5 | 0.122 (0.243) | 0.710 (1.459) | 0.286 (0.491) | 0.021 (0.010) | 0.330 | 0.976 | 0.002 | |
| 4 | 0.123 (0.247) | 0.721 (1.478) | 0.290 (0.500) | 0.021 (0.010) | 0.336 | 0.982 | 0.002 | |
| 10 | 0.123 (0.248) | 0.728 (1.495) | 0.290 (0.500) | 0.021 (0.010) | 0.336 | 0.981 | 0.002 | |
| >10 | 0.123 (0.248) | 0.728 (1.495) | 0.290 (0.500) | 0.021 (0.010) | 0.336 | 0.981 | 0.002 | |
| Average | 0.122 (0.233) | 0.718 (1.370) | 0.288 (0.476) | 0.021 (0.009) | ||||
| Normalized sum over AGP, mg/m3/min | 1 | 0.027 (0.019) | 0.094 (0.112) | 0.063 (0.040) | 0.020 (0.012) | 0.123 | 0.542 | <0.001 |
| 2.5 | 0.028 (0.012) | 0.096 (0.114) | 0.064 (0.040) | 0.021 (0.012) | 0.123 | 0.535 | <0.001 | |
| 4 | 0.028 (0.020) | 0.098 (0.116) | 0.065 (0.040) | 0.021 (0.012) | 0.120 | 0.538 | <0.001 | |
| 10 | 0.028 (0.020) | 0.100 (0.118) | 0.065 (0.040) | 0.021 (0.012) | 0.123 | 0.531 | <0.001 | |
| >10 | 0.028 (0.020) | 0.098 (0.118) | 0.065 (0.040) | 0.021 (0.012) | 0.123 | 0.531 | <0.001 | |
| Average | 0.028 (0.019) | 0.097 (0.107) | 0.064 (0.034) | 0.021 (0.012) | ||||
|
Ambient Level |
Particle size, µm |
+0 ACH |
+20 ACH |
Statistical analyses (p value by factor) |
||||
|---|---|---|---|---|---|---|---|---|
|
No assistant |
Assistant |
No assistant |
Assistant |
Assistant |
ACH |
Assistant by ACH |
||
|
Data were subjected to 2-way ANOVA with a significance level of p < 0.05; significant effects are noted in bold for each variable. The data in this table are the descriptive statistics and are not transformed. The statistical analyses were performed on transformed data. |
||||||||
| Time to baseline, min | 2.68 (4.99) | 2.25 (4.05) | 0 (0) | 0 (0) | 0.613 | 0.005 | ||
| Peak aerosol, mg/m3 | 1 | 0.113 (0.106) | 0.359 (0.241) | 0.122 (0.150) | 0.538 (0.826) | 0.027 | 0.349 | 0.583 |
| 2.5 | 0.143 (0.146) | 0.418 (0.257) | 0.144 (0.177) | 0.641 (0.980) | 0.025 | 0.326 | 0.590 | |
| 4 | 0.173 (0.186) | 0.481 (0.281) | 0.168 (0.208) | 0.704 (1.042) | 0.024 | 0.322 | 0.579 | |
| 10 | 0.264 (0.254) | 0.821 (0.525) | 0.316 (0.425) | 0.998 (1.400) | 0.027 | 0.344 | 0.511 | |
| >10 | 0.326 (0.278) | 1.209 (0.860) | 0.430 (0.610) | 1.320 (1.870) | 0.026 | 0.309 | 0.482 | |
| Average | 0.203 (0.193) | 0.658 (0.433) | 0.236 (0.314) | 0.840 (1.215) | ||||
| Normalized sum over AGP, mg/m3/min | 1 | 0.046 (0.027) | 0.082 (0.033) | 0.053 (0.021) | 0.060 (0.060) | 0.386 | 0.862 | 0.019 |
| 2.5 | 0.057 (0.034) | 0.100 (0.038) | 0.065 (0.023) | 0.072 (0.068) | 0.385 | 0.812 | 0.018 | |
| 4 | 0.067 (0.040) | 0.116 (0.046) | 0.074 (0.026) | 0.081 (0.070) | 0.353 | 0.794 | 0.020 | |
| 10 | 0.103 (0.062) | 0.181 (0.081) | 0.110 (0.045) | 0.114 (0.082) | 0.262 | 0.724 | 0.048 | |
| >10 | 0.124 (0.073) | 0.235 (0.117) | 0.123 (0.060) | 0.141 (0.102) | 0.214 | 0.574 | 0.078 | |
| Average | 0.079 (0.057) | 0.143 (0.087) | 0.087 (0.047) | 0.093 (0.079) | ||||
| Normalized sum over appointment, mg/m3/min | 1 | 0.032 (0.014) | 0.049 (0.018) | 0.046 (0.037) | 0.040 (0.025) | 0.451 | 0.926 | 0.076 |
| 2.5 | 0.041 (0.019) | 0.060 (0.023) | 0.054 (0.042) | 0.048 (0.029) | 0.478 | 0.907 | 0.081 | |
| 4 | 0.047 (0.022) | 0.069 (0.029) | 0.062 (0.054) | 0.054 (0.031) | 0.452 | 0.904 | 0.096 | |
| 10 | 0.070 (0.031) | 0.103 (0.045) | 0.093 (0.085) | 0.081 (0.045) | 0.336 | 0.860 | 0.155 | |
| >10 | 0.086 (0.034) | 0.132 (0.054) | 0.111 (0.096) | 0.103 (0.058) | 0.246 | 0.644 | 0.193 | |
| Average | 0.055 (0.024) | 0.083 (0.033) | 0.073 (0.063) | 0.065 (0.037) | ||||
Discussion
The results of this study underscore the effect of additional ACH on modulating the concentration of aerosols following AGPs. Our results suggest that 20 additional ACH significantly reduced the time to return to baseline following AGP. In fact, in most instances with additional ACH, baseline values were achieved before the end of the AGP, suggesting that aerosols are cleared from the air before the end of the appointment and the start of the fallow period.
These results are in line with previous studies showing that most dental aerosol contamination of surfaces occurs in the 10-min period post-AGP, with little further detection after that with 6 additional ACH in a closed operatory.8,10-12 Our study is the first to investigate the impact of a high-level ACH (+20) and our results suggest that clinician and patient safety are not further improved with greater ventilation rates compared with no additional air changes. A review of the return to practice guidelines16 cites highly variable recommendations across international resources, with only 48% of reviewed documents suggesting a fallow period after providing AGP. The fallow times reported by Clarkson and colleagues16 range from 2 to 180 min, with the Canadian recommendations the strictest, requiring up to 3 h if information on the number of additional ACH is not known.
This is the first study to assess fallow periods following air polishing by modified guided biofilm therapy techniques. This therapy produces more droplets and aerosols during the process of removing biofilm and stain than any other dental hygiene equipment. The use of dental suction has been shown to have a substantial positive effect on the capture of droplets and aerosols.8,12,17 HVE can reduce contamination at the site of AGP production by 90%.18 However, there could be a limitation on the efficiency of HVE when the primary operator is responsible for both producing and capturing the aerosol. Therefore, we hypothesized that the presence of an assistant operating dental suction units would reduce the amount of aerosol escaping the oral cavity, similar to the additional benefit observed during a simulated crown preparation with the combination of HVE and ReLeaf.19
Contrary to our hypothesis, the presence of an assistant had no significant effect on the time to return to baseline values following AGP. In fact, the presence of an assistant significantly increased the maximum concentration of aerosol at all particulate matter sizes (1, 2.5, 4, 10 and >10 µm). Although the primary operator conducted all appointments in a similar sequence, the assistant operating the HVE cannot always anticipate their next movement. Also, the assistant had a limited field of view and likely experienced variations in the proximity of the HVE tip to the aerosol-generating instrument, ultimately impacting the effectiveness of the HVE in capturing aerosol.
The working location of the primary operator relative to the head of the dental chair also changed with the presence of an assistant, which likely had an effect on the path of the aerosols. Previous studies of aerosol generation using fluorescein dyes found that the patient’s chest was the most contaminated site, followed closely by the primary operator’s chest and visor.11,12 Although these sites were not directly measured in this study, these findings highlight the importance of proper personal protective equipment during AGPs, not only for the clinicians but also for the patient. After an AGP, the patient is also contaminated; therefore, we suggest that patients be draped during their AGP.
This study had several benefits, including the use of actual patients in a clinical setting. Much of the previous research has been conducted using mannequins, which do not mimic a real-life scenario. Although considered a benefit to the study, conducting AGPs on human participants is likely a contributing factor to the high variability observed in the data. The primary operator followed the same sequence for all patients, but the patient’s oral opening, required chair angulation for patient comfort and other patient-related factors (moving/breathing/talking/laughing) likely impacted aerosol capture and subsequent fallow time.
A limitation of the study was the inability to blind the primary operator to the treatment type. Working alone or with no additional ACH may have biased the primary operator to focus differently on the capture of aerosols. This study highlights the importance of multiple intra-oral suctions during dental treatment and the importance of evacuation techniques for both 2- and 4-handed dentistry to ensure the immediate capture of aerosols and droplets at the site of their creation.
Other limitations of the study include using only 2 aerosol detectors in the operatory: 1 at counter-level 1 m from the head of the dental chair and the other at the shoulder of the primary operator. Ideally, multiple detectors would be used to assess the various factors modulating aerosol escape and detection over larger areas. Future work should consider the placement of an aerosol detector at 30 cm from the site of aerosol creation as previous studies have indicated the use of HVE may reduce bacterial contamination in aerosols less than 30 cm from the site of infection, but not at greater distances.13 The method used in this study did not provide any information on viral contamination of the aerosols produced and captured. Therefore, future work should consider the inclusion of live tracers placed at strategic sites and distances from the site of infection to improve our understanding of viral and bacterial contamination within a dental operatory following SPT. Of importance to note, this study included only healthy patients who screened negative for COVID-19; therefore, the expectation of discovering the virus on live tracers was hypothesized to be unlikely.
In summary, under the clinical conditions of this study, an additional 20 ACH were adequate to eliminate aerosols produced during a dental procedure by the end of the AGP. Moreover, 20 additional ACH return the operatory to baseline levels of aerosol faster than without additional ACH. The results of this study underscore the importance of ventilation and air changes during the process of aerosol generation in terms of safety for patients and clinicians. They do not support the need for a fallow period after the cessation of the AGP, nor after the end of the appointment.
THE AUTHORS
 |
Dr. Longo is chief innovation officer, Periodontal Wellness Research, Periodontal Wellness & Implant Surgery, Fonthill, Ontario. |
 |
Ms. Rier is a PhD candidate, Faculty of Engineering, McMaster University, Hamilton, Ontario. |
 |
Ms. Porter is a registered dental hygienist, Periodontal Wellness Research, Periodontal Wellness & Implant Surgery, Fonthill, Ontario. |
 |
Dr. Wohl is associate professor, Department of Mechanical Engineering, McMaster University, Hamilton, Ontario. |
 |
Dr. Fritz is the owner of Periodontal Wellness Research, Periodontal Wellness & Implant Surgery, Fonthill, Ontario; adjunct professor, Faculty of Applied Health Sciences, Brock University, St. Catharines, Ontario; and adjunct professor, Faculty of Health Sciences, Michael DeGroote School of Medicine, McMaster University, Hamilton, Ontario. |
Corresponding author: Dr. Peter C. Fritz, 1-165 Highway 20 W, Fonthill ON L0S 1E5. Email: peter@drpeterfritz.com
Acknowledgements: The authors thank Sade Primo and Dr. Wendy E. Ward for their contributions to the study.
The authors have no declared financial interests.
This article has been peer reviewed.
References
- Pascolo L, Zupin L, Melato M, Tricarico PM, Crovella S. TMPRSS2 and ACE2 co-expression in SARS-CoV-2 salivary gland infection. J Dent Res. 2020;99(10):1120-1.
- Xu J, Li Y, Gan F, Du Y, Yao Y. Salivary glands: potential reservoirs for COVID-19 asymptomatic infection. J Dent Res. 2002;99(8):989.
- Ge ZY, Yang LM, Xia JJ, Fu XH, Zhang YZ. Possible aerosol transmission of COVID-19 and special precautions in dentistry. J Zhejiang Univ Sci B 2020;21(5):361-8.
- Infection prevention and control of epidemic- and pandemic-prone acute respiratory infections in health care. Geneva: World Health Organization; 2014. Available: https://www.who.int/publications/i/item/infection-prevention-and-control-of-epidemic-and-pandemic-prone-acute-respiratory-infections-in-health-care (accessed 2023 Jan. 5).
- Raghava N, Vidovic B. Using computational fluid dynamics to evaluate the role of air purification in reducing fallow time in dentistry. Int J Dent Oral Health 2021;7(4). Available: https://www.researchgate.net/publication/353179574_Using_Computational_Fluid_Dynamics_to_Evaluate_the_Role_of_Air
_Purification_in_Reducing_Fallow_Time_in_Dentistry - COVID-19: managing infection risks during in-person dental care. Toronto: Royal College of Dental Surgeons of Ontario; 2020. Available: https://www.rcdso.org/en-ca/standards-guidelines-resources/2019-novel-coronavirus/covid-19--managing-infection-risks-during-in-person-care (accessed 2023 Mar. 29).
- Appendix B. Air. Guidelines for environmental infection control in health-care facilities (2003). Atlanta, Ga.: Centers for Disease Control and Prevention; 2019. Available: https://www.cdc.gov/infectioncontrol/guidelines/environmental/appendix/air.html#tableb (accessed 2023 Mar. 29).
- Holliday R, Allison JR, Currie CC, Edwards DC, Bowes C, Pickering K, et al. Evaluating contaminated dental aerosol and splatter in an open plan clinic environment: implications for the COVID-19 pandemic. J Dent. 2021;105:103565.
- Han P, Li H, Walsh LJ, Ivanovski S. Splatters and aerosols contamination in dental aerosol generating procedures. Appl Sci. 2021;11(4):1914. Available: https://www.mdpi.com/2076-3417/11/4/1914 (accessed 2023 Mar. 29).
- Shahdad S, Hindocha A, Patel T, Cagney N, Mueller JD, Kochid A, et al. Fallow time determination in dentistry using aerosol measurement in mechanically and non-mechanically ventilated environments. Br Dent J. 2021:1-8.
- Allison JR, Currie CC, Edwards DC, Bowes C, Coulter J, Pickering K, et al. Evaluating aerosol and splatter following dental procedures: addressing new challenges for oral health care and rehabilitation. J Oral Rehabil. 2021;48(1):61-72.
- Shahdad S, Patel T, Hindocha A, Cagney N, Mueller JD, Seoudi N, et al. The efficacy of an extraoral scavenging device on reduction of splatter contamination during dental aerosol generating procedures: an exploratory study. Br Dent J. 2020:1-10.
- Nagraj SK, Eachempati P, Paisi M, Nasser M, Sivaramakrishnan G, Verbeek JH. Interventions to reduce contaminated aerosols produced during dental procedures for preventing infectious diseases. Cochrane Database Syst Rev. 2020;10(10):CD013686.
- Balanta-Melo J, Gutiérrez A, Sinisterra G, del Mar Diaz-Posso M, Gallego D, Villavicencio J, et al. Rubber dam isolation and high-volume suction reduce ultrafine dental aerosol particles: an experiment in a simulated patient. Appl Sci. 2020;10(18):6345. Available: https://www.mdpi.com/2076-3417/10/18/6345 (accessed 2023 Mar. 29).
- Tonetti MS, Greenwell H, Kornman KS. Staging and grading of periodontitis: framework and proposal of a new classification and case definition. J Periodontol. 2018;89(Suppl 1):S159-72.
- Clarkson J, Ramsay C, Richards D, Robertson C, Aceves-Martins M; on behalf of the CoDER Working Group. Aerosol generating procedures and their mitigation in international dental guidance documents – a rapid review. London: Cochrane Oral Health; 2020. Available: https://oralhealth.cochrane.org/news/aerosol-generating-procedures-and-their-mitigation-international-guidance-documents (accessed 2023 Mar. 29).
- Ravenel TD, Kessler R, Comisi JC, Kelly A, Renne WG, Teich ST. Evaluation of the spatter-reduction effectiveness and aerosol containment of eight dry-field isolation techniques. Quintessence Int. 2020;51(8):660-70.
- Narayana TV, Mohanty L, Sreenath G, Vidhyadhari P. Role of preprocedural rinse and high volume evacuator in reducing bacterial contamination in bioaerosols. J Oral Maxillofac Pathol. 2016;20(1):59-65.
- Comisi JC, Ravenel TD, Kelly A, Teich ST, Renne W. Aerosol and spatter mitigation in dentistry: analysis of the effectiveness of 13 setups. J Esthet Restor Dent. 2021;33(3):466-79.