Abstract
Objective: To examine sex-specific differences in the demographics and work patterns of Canadian orthodontists.
Methods: Questionnaires were mailed and emailed to a random sample of 384 orthodontists: 289 men and 95 women. Questions regarding work patterns and personal demographics were created and results were compared by sex.
Results: The response rate was 53.9%. The demographics and work patterns for male and female orthodontists were similar for most variables. Women were found to be 6 years younger; have 6 fewer years of work experience; expect to retire earlier; be more often married to a professional in full-time employment; and be more likely to take a leave of absence during their career than their male colleagues. Age significantly affected the number of hours worked per week and number of phase II starts per year; both variables increased with increasing age until approximately 50 years, after which they decreased with age. Having children did not significantly affect any of the analyzed variables.
Conclusions: As the practice of female orthodontists was not found to be substantially different from that of men, it is not possible to speculate whether the increasing number of women specializing in orthodontics will provoke a significant change in the profession. As this is the first survey of its kind in Canada, these results may be used as a reference for future comparisons to determine work patterns and trends in the orthodontic workforce.
The number of women entering and working in formerly male-dominated health professions has increased significantly in recent decades.1,2 As more women pursue professional careers, the number specializing within their profession is expected to increase as well, a trend that has been observed in the dental specialty of orthodontics.
In the initial Journal of Clinical Orthodontics American Practice Study3 in 1981, 0.6% of responding orthodontists were women; in repeated practice studies during 2005–2011,4-7 women constituted 12–14% of the respondents. The number of women specializing in orthodontics is expected to continue to increase. In 1999, 34% of orthodontic residents in the United States were women,8 whereas in 2010, the proportion of female residents had increased to 39%.9 Similar trends have been observed in Canada: in 2006, 36% of orthodontic residents were women10; in 2013, the proportion was 47%.
Men and women receive the same education and training in their specialty programs; however, they have historically assumed different roles and responsibilities with respect to work and raising a family. Therefore, there is speculation that men and women will practise the same profession differently. As the proportion of women specializing in orthodontics has increased and is expected to continue to increase, speculations have been made concerning the potential effect this may have on the profession.11-13
The purpose of this study was to assess the current work patterns of male and female Canadian orthodontists to determine whether any sex-specific differences exist. We examined personal and practice demographics, family structure, work patterns and practice characteristics and conducted sex-specific comparisons to identify factors that influence practice and work pattern characteristics, in an effort to consider whether the increased proportion of female orthodontists in Canada will affect the future delivery of orthodontic care.
Methods
A questionnaire was developed based on a previously published study comparing differences in practice patterns among male and female orthodontists in the United States.14 Following a pilot study, in which a revised questionnaire was given to a group of 5 local orthodontists to check for question error and relevancy, minor amendments were made and the final questionnaire was produced. The questionnaire and all correspondence were translated professionally from English to French to minimize potential language barriers for respondents. Three of the orthodontists involved in the pilot study were bilingual; they completed the survey in both French and English to ensure accuracy of the translation.
The estimated number of orthodontic specialists in Canada is 799, of which it is estimated that 191 are women (24%) and 608 are men (76%). A sample size of 378 was determined to be adequate for statistical power.15 To ensure quota sampling and prevent overrepresentation of either sex, this sample size was divided into a target sample of 89 (24%) female and 289 (76%) male orthodontists.
Participants were selected by numbering the lists of orthodontists, which had been stratified according to region of primary practice address and sex, and using a random number generator (SPSS version 20.0, IBM, Armonk, NY) to determine who to approach with the survey.
For survey implementation and data analysis, 2 distinct databases were created to ensure participant confidentiality. Orthodontists selected for participation received a copy of the survey package through regular mail, addressed to their primary practice address and, where email addresses were available, through email with a URL link to the online version (Survey Monkey, Palo Alto, CA). The survey package consisted of two letters; a letter of introduction and a hand-signed letter with a URL address and instructions for accessing the online questionnaire, a copy of the questionnaire and a self-addressed stamped return envelope. Participants in Quebec received all correspondence in both English and French. In addition, the online version was available in English or French. Each survey was linked to a blinded identification marker in the upper right hand corner of the questionnaire, body of the email and information letter for online survey access to differentiate respondents from non-respondents.
All selected survey participants were mailed and/or emailed an initial survey package by 17 April 2013, and a second "reminder" package was sent to non-respondents by 27 May 2013. In addition, an email information package was sent to all female orthodontists practising in the eastern region of Canada (n = 6), that were not included in the original random sample, on 3 July 2013, in an attempt to obtain a representative sample; this increased the total number of surveys sent to 384.
For mail-based surveys, data were entered manually, while web-based surveys were automatically compiled into Excel 2011 spreadsheets (Microsoft, Redmond, Wash.). Manually entered data were checked twice to ensure accuracy and web-based surveys were inspected to ensure that recorded data were relevant to questions asked (i.e., numerical versus text responses). The two spreadsheets were then combined. All data analyses were performed using SPSS version 20.0. Before completing testing, model assumptions were evaluated; when they were not satisfactorily met, further analyses were completed, which is described below. For all tests, statistical significance was set at α = 0.05.
Descriptive statistics were generated for each variable, including means, standard deviation, standard error, medians, ranges and total number of respondents. Cross-tabulations, with sex as the independent variable, were created, when applicable.
When appropriate, contingency tables were formulated and Pearson χ2 values and probabilities were computed. In the comparison of means, ANOVA was used. When multiple means were compared, a one-way ANOVA in conjunction with Bonferroni post-hoc test was used. When equal variances between the 2 populations were not satisfied, the data were compared using either Tamhane's post-hoc test or log-linear transformation.
The work patterns of Canadian orthodontists were evaluated, using the number of hours worked per week, number of patients seen per workday and number of new case starts per year (in 2012) as the response variables. The effects of sex on work patterns were evaluated, applying age and number of children or children living at home as covariates in the analysis using multivariate analysis of covariance (MANCOVA) in conjunction with Bonferroni post-hoc test.
In the evaluation of work-pattern differences, the number of female orthodontists in the survey sample was significantly lower than that of male orthodontists (27 and 134, respectively). After completing an overall analysis, a random sample of 40 male respondents was selected to maintain the number of male respondents at 1.5 times the number of female respondents to increase statistical power. Analysis of a random sample was repeated 20 times and compared with an analysis of the entire population (27 women and 134 men). Because similar trends resulted from the repeated random samples and the overall analysis, the overall population analysis was used in the discussion of results as this includes all of the information collected in the survey.
Approval from the University of Alberta's Research Ethic Board was granted for this research (Pro00036677).
Results
The final sample size for the survey was 371 (280 men, 91 women). As of 28 July 2013, we received 207 responses (53.9% response rate), of which 94 (45.4%) were completed online and 113 (54.6%) were mailed. Of the respondents, 160 (77.3%) were men and 42 (20.3%) were women, 5 (2.4%) did not specify their sex.
Demographics
The average age of all respondents was 51 years. The age range for men was 29–77 years (mean 52.3, median 52); the age range for women was 32–65 years (mean 46.4, median 45). Average age differed significantly between the sexes: men were, on average, 5.9 years older than women (p = 0.002) (Table 1).
Respondents had graduated primarily from Canadian dental schools and orthodontic training programs, with no significant differences between the sexes (p > 0.05) (Table 2). Age at graduation from dental school and orthodontic training was similar for men and women. The average age at graduation from dental school was 25.6 years (p = 0.900), while the average age at graduation from orthodontic training was 31.4 years (p = 0.335) (Table 1).
Most male and female orthodontists were married, with no significant differences between the sexes (p = 0.212) (Table 2).
Spouses of male orthodontists were less likely to work full time than spouses of female orthodontists. Of the married female respondents, 94% reported full-time spousal employment; 25% of the married male respondents reported having spouses who were employed full time, 45% were employed part time and 30% were not currently employed. Female respondents' spouses were most likely to be dentists, including dental specialists. Most male respondents' spouses were employed in a "non-health other occupation," the most common being office manager/administrative duties and bookkeeper (Table 2).
The number of children of male respondents ranged between 0 and 7, while the range for female respondents was 0–5. The average number of children for both men and women was 2.2 (median 2), with no significant difference between the sexes (p = 0.189) (Table 2).
The mean age at which both male and female orthodontists had their first and second children did not differ significantly (p = 0.976): 30.8 and 33.6 years for men and 31.8 and 33.6 years for women (Table 1).
| Men | Women | All respondents | p | |||||||
|---|---|---|---|---|---|---|---|---|---|---|
| Mean | Median | SE | Mean | Median | SE | Mean | Median | SE | ||
| Note: SE = standard error. *statistically significant p-values |
||||||||||
| Current | 52.3 | 52.0 | 0.9 | 46.4 | 45 | 1.4 | 51.2 | 51.0 | 0.9 | 0.002* |
| Dental school | 25.6 | 25 | 0.25 | 25.5 | 24 | 0.72 | 25.6 | 25 | 0.25 | 0.900 |
| Ortho training | 31.5 | 32 | 0.36 | 30.7 | 31 | 0.56 | 31.4 | 31.5 | 0.31 | 0.335 |
| Child 1 | 30.8 | 30.5 | 0.46 | 31.8 | 33 | 0.96 | 31.0 | 31 | 0.41 | 0.976 |
| Child 2 | 33.6 | 33 | 0.40 | 33.6 | 34 | 0.92 | 33.6 | 33 | 0.36 | |
| Planned retirement | 64.1 | 65 | 0.590 | 61.1 | 61 | 0.821 | 63.5 | 65 | 0.503 | 0.013* |
| Characteristic | Men | Women | |||
|---|---|---|---|---|---|
| No. | % | No. | % | p | |
| Note: The totals differ in each category based on the number of respondents per question. *p-values were not calculated between male and female orthodontist spousal occupation and employment status as there were very small numbers in the female groups for statistical strength in comparison. |
|||||
| Location of dental training | |||||
| Canada | 139 | 88.0 | 35 | 85.4 | 0.653 |
| United States | 12 | 7.6 | 2 | 4.9 | |
| Other | 7 | 4.4 | 4 | 9.8 | |
| Total | 158 | 41 | |||
| Location of ortho training | |||||
| Canada | 109 | 68.6 | 28 | 68.3 | 0.974 |
| United States | 47 | 29.6 | 13 | 31.7 | |
| Other | 3 | 1.9 | 0 | 0.0 | |
| Total | 159 | 41 | |||
| Marital status | |||||
| Single | 15 | 9.4 | 6 | 15.0 | 0.212 |
| Divorced | 7 | 4.4 | 2 | 5.0 | |
| Married | 126 | 79.2 | 28 | 70.0 | |
| Separated | 3 | 1.9 | 1 | 2.5 | |
| Common-law | 7 | 4.4 | 3 | 7.5 | |
| Widowed | 1 | 0.6 | 0 | 0 | |
| Total | 159 | 40 | |||
| Spousal employment status | |||||
| Full time | 35 | 25.2 | 31 | 93.9 | —* |
| Part time | 63 | 45.3 | 1 | 3.0 | |
| Not currently employed | 41 | 29.5 | 1 | 3.0 | |
| Total | 139 | 33 | |||
| Spousal occupation | |||||
| Student | 1 | 0.8 | 0 | 0 | —* |
| Dentist | 18 | 13.8 | 18 | 54.5 | |
| Physician | 6 | 4.6 | 0 | 0 | |
| Houseparent/homemaker | 27 | 20.8 | 0 | 0 | |
| Other health profession | 27 | 20.8 | 2 | 6.1 | |
| Non-health professional | 16 | 12.3 | 7 | 21.2 | |
| Non-health other occupation | 33 | 25.4 | 6 | 18.2 | |
| Other | 2 | 1.5 | 0 | 0 | |
| Total | 130 | 33 | |||
| Number of children | |||||
| 0 | 21 | 13.7 | 5 | 13.9 | 0.189 |
| 1 | 10 | 6.5 | 7 | 19.4 | |
| 2 | 59 | 38.6 | 14 | 38.9 | |
| 3 | 47 | 30.7 | 7 | 19.4 | |
| 4 | 13 | 8.5 | 2 | 5.6 | |
| 5 | 0 | 0 | 1 | 2.8 | |
| 6 | 2 | 1.3 | 0 | 0 | |
| 7 | 1 | 0.7 | 0 | 0 | |
| Total | 153 | 36 | |||
Practice Information
Men were most likely to practise solo (65%), followed by group practice limited to orthodontics (29%). The most common arrangements for women were working as a solo practitioner (48%) and in a group practice limited to orthodontics (48%). Analysis of the data for "solo practitioner" versus "other," including all other forms of practice, showed weak evidence to suggest that men are slightly more likely to work as a solo practitioner than their female colleagues (p = 0.061) (Table 3).
Location of main office was similar for both sexes. Both men and women were most likely to work in a metropolitan area. The second most common office location for both sexes was in a large city, followed by a small city and a rural area. There was no significant difference in the mean number of offices worked in for men and women (p = 0.241), with both sexes most commonly working in 1 office (Table 3).
Ownership status was similar for both sexes. Both men and women most commonly owned an orthodontic practice (77% of men; 71% of women). The second most common status was owning part of an orthodontic practice, followed by non-owner (Table 3). Comparing owning an orthodontic practice versus non-owner revealed no significant differences between the sexes (p = 0.588).
There was evidence to suggest a significant difference between the sexes for previously working as an orthodontic associate (p = 0.083): 47% of men and 62% of women (Table 3). However, the number of years worked as an associate did not differ significantly between the sexes (p = 0.545): the average length of associateship was 4.4 years for men and 5.1 years for women (Table 4).
| Practice parameter | Men | Women | |||
|---|---|---|---|---|---|
| No. | % | No. | % | p | |
| Note: The totals differ in each category based on the number of respondents per question. * Percentages do not total 100%, as respondents were able to select any or all of the selections that currently apply to them † p-value was calculated with outliers 21 and 28 removed. |
|||||
| Practice type* | |||||
| In a group practice limited to orthodontics | 46 | 28.8 | 20 | 47.6 | 0.061 |
| In a group practice with other specialties | 14 | 8.8 | 3 | 7.1 | |
| Providing orthodontic services in general dental practice | 17 | 10.6 | 4 | 9.5 | |
| As a solo practitioner | 104 | 65.0 | 20 | 47.6 | |
| As an educator | 17 | 10.6 | 7 | 16.7 | |
| As a researcher | 5 | 3.1 | 1 | 2.4 | |
| Do not currently practise | 1 | 0.6 | 0 | 0 | |
| Other | 5 | 3.1 | 3 | 7.1 | |
| Number of offices | 0.512† | ||||
| 0 | 0 | 0 | 1 | 2.5 | |
| 1 | 84 | 54.2 | 21 | 52.5 | |
| 2 | 45 | 29.0 | 14 | 35.0 | |
| 3 | 20 | 12.9 | 3 | 7.5 | |
| 4 | 3 | 1.9 | 0 | 0 | |
| 5 | 1 | 0.6 | 0 | 0 | |
| 6 | 1 | 0.6 | 0 | 0 | |
| 21 | 0 | 0 | 1 | 2.5 | |
| 28 | 1 | 0.6 | 0 | 0 | |
| Total | 155 | 40 | |||
| Size of community | |||||
| Rural (> 20 000) | 6 | 3.8 | 1 | 2.4 | 0.794 |
| Small city (20 001–50 000) | 19 | 11.9 | 4 | 9.8 | |
| Large city (50 001–500 000) | 65 | 40.6 | 16 | 39.0 | |
| Metropolitan (> 500 000) | 70 | 43.8 | 20 | 48.8 | |
| Total | 160 | 41 | |||
| Ownership status | |||||
| Owns an orthodontic practice | 123 | 76.9 | 30 | 71.4 | 0.588 |
| Owns part of an orthodontic practice | 18 | 11.3 | 6 | 14.3 | |
| Owns an orthodontic practice and part of an orthodontic practice | 6 | 3.8 | 1 | 2.4 | |
| Non-owner | 13 | 8.1 | 5 | 11.9 | |
| Total | 160 | 42 | |||
| Satisfaction with the profession | |||||
| Extremely satisfied | 89 | 55.6 | 28 | 68.3 | 0.508 |
| Satisfied | 58 | 36.3 | 11 | 26.8 | |
| Moderately satisfied | 12 | 7.5 | 2 | 4.9 | |
| Dissatisfied | 1 | 0.6 | 0 | 0.0 | |
| Extremely dissatisfied | 0 | 0.0 | 0 | 0.0 | |
| Total | 160 | 41 | |||
| Associateship status | |||||
| Has never worked as an orthodontic associate | 84 | 53.2 | 16 | 38.1 | 0.083 |
| Has worked or is currently working as an orthodontic associate | 74 | 46.8 | 26 | 61.9 | |
| Total | 158 | 42 | |||
| Association and leaves | Men | Women | Total | p | |||||||||
|---|---|---|---|---|---|---|---|---|---|---|---|---|---|
| Mean | Median | SE | No. | Mean | Median | SE | No. | Mean | Median | SE | |||
| Note: SE = standard error. *comparison between the sexes and p-value were not calculated as number of orthodontists taking a leave of absence in 2012 was small. |
|||||||||||||
| Length of associateship (years) | 4.4 | 3 | 0.58 | 74 | 5.1 | 3 | 1.14 | 26 | 4.4 | 3 | 0.489 | 0.55 | |
| Vacation (weeks) | 7.2 | 6 | 0.400 | 158 | 6.7 | 7 | 0.401 | 41 | 7.1 | 6 | 0.328 | 0.611 | |
| Leaves of absence | |||||||||||||
| Length in 2012 (weeks) | 7.3 | 8 | 1.167 | 9 | 6.7 | 8 | 2.404 | 3 | 7.2 | 8 | 1.006 | —* | |
| Length over career (weeks) | 9.6 | 7 | 4.411 | 16 | 17.4 | 8 | 4.158 | 18 | 13.8 | 8 | 3.674 | 0.206 | |
| Number over career | 1.2 | 1 | 0.200 | 16 | 1.6 | 1 | 0.246 | 18 | 1.4 | 1 | 0.174 | 0.337 | |
Additional Information
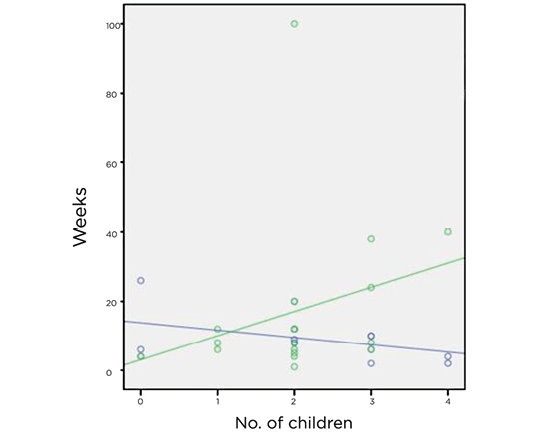 Figure 1: Total duration (weeks) of leaves of absence throughout career compared with number of children (includting step-children) for male (blue) and female (green) orthodontists. Men: R2 linear = 0.180; women: R2 linear = 0.078.
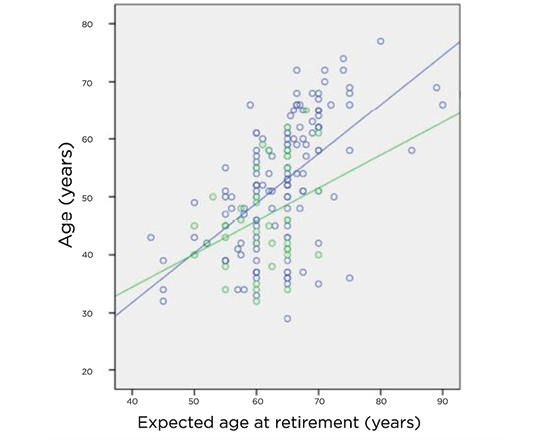 Figure 2: Age of male (blue) and female (green) orthodontists related to their expected age at retirement. Men: R2 linear = 0.316; women: R2 linear = 0.121.
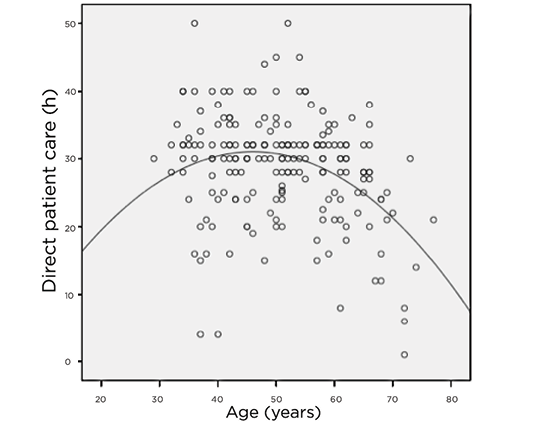 Figure 3: Scatterplot (with fitted quadratic equation using regression analysis, R2 quadratic = 0.135) of age of orthodontists versus number of hours in direct patient care.
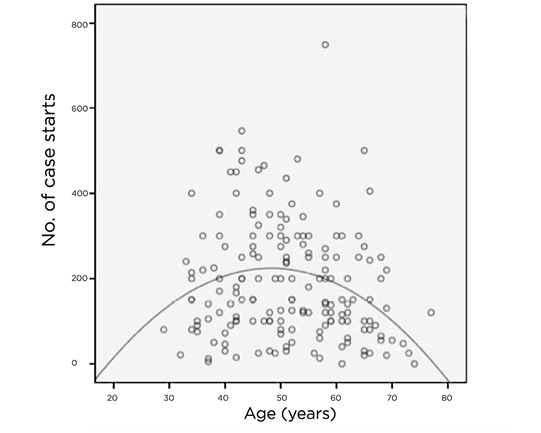 Figure 4: Scatterplot (with fitted quadratic equation using regression analysis, R2 quadratic = 0.074) of age of orthodontists versus number of phase II case starts in 2012.
In 2012, there were no significant differences between the sexes in total weeks of vacation taken (p = 0.611). On average, Canadian orthodontists took 7 weeks of vacation (Table 4).
There was a significant difference between the sexes in terms of taking a leave of absence during their career (p < 0.001). In total, 10% of men and 44% of women indicated that they had taken a leave of absence. Men took an average of 1.2 total leaves of absence, with women taking an average of 1.6 leaves, but this difference was not significant (p = 0.337). In addition, there was no significant difference between the sexes in average length of leave of absence (p = 0.206). The average length of a leave of absence was 13.8 weeks: 9.6 for men (range 1–26) and 17.4 for women (range 1–100). The total number of leave-of-absence weeks over a career was moderately negatively correlated with number of children for men (r = −0.424, p = 0.057), and weakly positively correlated for women (r = 0.279, p = 0.130) (Fig. 1). The most common reason for men taking a leave of absence was personal illness, followed by extended vacation; for women, the most common reason was maternity, followed by personal illness and child rearing.
Average age of planned retirement for Canadian orthodontists was 63.5 years, with responses ranging from 43 to "never." Planned retirement age differed significantly between the sexes (p = 0.013): on average, women planned to retire 3 years earlier than their male colleagues (61 and 64 years, respectively). Age of respondents was moderately correlated with anticipated age at retirement (r = 0.552, p < 0.000); as the age of the orthodontist increased, the anticipated age at retirement increased. When stratified according to sex, age was strongly correlated with anticipated age at retirement for men (r = 0.562, p < 0.000) and moderately correlated for women (r = 0.347, p = 0.030) (Table 1, Fig. 2).
When asked to rate their satisfaction with the profession of orthodontics, most respondents indicated that they were extremely satisfied with their career choice (Table 3). There was no significant difference between the sexes (p = 0.508).
Work Patterns of Orthodontists in Canada
Number of hours worked per week, patients seen per workday and phase II case starts per year were compared between the sexes, while statistically controlling for age and number of children of the orthodontist.
Number of children and whether the children lived at home did not significantly affect the work patterns (p = 0.244 and p = 0.352, respectively). However, there was convincing evidence to suggest that age affects the number of hours worked per week (p = 0.001) and number of phase II case starts per year (p = 0.015), but not the number of patients seen per day (p = 0.373).
When age was controlled statistically (evaluated at 51.1 years), there was weak evidence to suggest a significant difference between the sexes in terms of hours worked per week (p = 0.071). On average, men spent 29 h/week in direct patient care, and women 26 h/week. However, there was a no significant difference between the sexes in number of phase II case starts per year (p = 0.128).
A quadratic relationship was found to exist between age of the orthodontist and number of hours worked per week (R2 = 0.135) and number of phase II case starts per year (R2 = 0.074). Number of hours worked/case starts increased with increasing age, peaking at approximately 50 years of age and decreasing after that with increasing age (Table 5, Figs. 3 and 4).
Finally, there was no evidence to suggest a significant difference between the sexes in number of patients seen per day (p = 0.504). Men saw an average of 54.5 patients per workday, while women saw an average of 57.4.
| Variable | Group | Mean | SE | p | 95% CI | |
|---|---|---|---|---|---|---|
| Lower | Upper | |||||
| Note: CI = confidence interval, SE = standard error. *Evaluated at age = 51.10 years. |
||||||
| Hours per week | Men | 29.3 | 0.642 | 0.071 | −0.255 | 6.057 |
| Women | 26.4 | 1.452 | ||||
| Phase II starts | Men | 199.8 | 11.747 | 0.128 | −12.982 | 102.441 |
| Women | 155.1 | 26.560 | ||||
Discussion
The personal and practice demographics and work patterns of male and female orthodontists in Canada are fairly similar; however, some sex-specific differences were found to exist.
Female orthodontists in Canada are younger, on average, than their male colleagues, and this age discrepancy translates into women having fewer years of clinical experience, as supported by the literature4-7,12-14,16-19 and the significant increase in the number of women entering the dental profession and specialties in the past few decades. The differences are expected to decrease as the number of senior male orthodontists retiring from practice increases.
Both male and female orthodontists are equally likely to be married; however, women are more likely to be married to a professional who is employed full-time. This finding is not supported by the literature, where previous surveys have indicated that male dentists and specialists are more likely than women to be married.14,17-21 Most female respondents reported that their spouses were employed full-time and working as dentists and dental specialists. Most male respondents' spouses were employed part-time or not currently employed, working in a non-health occupation or as a houseparent/homemaker. A similar study in the United States found comparable results.14 This factor is important as motivation to work is, in part, determined by financial need to support a family. If the combined family income of female orthodontists is greater than male orthodontists (i.e., because female orthodontists are more likely to be married to a professional while male orthodontists are more likely to be married to a non-professional), the work patterns of female orthodontists may be markedly different from those of their male colleagues.17
At the time of this survey, female orthodontists were expecting to retire at an earlier age than their male colleagues. Anticipating an age of retirement is difficult and by no means an accurate representation of true age of retirement. Although a statistically significant difference was found between men and women in this respect, it is not likely of any practical consequence. The women who participated in this survey were, on average, 6 years younger than their male colleagues, and we found that younger people expected to retire at an earlier age than older individuals. However, if women have less financial commitment to work than their male colleagues, there may be a significant difference between the sexes in actual age of retirement as the number of female orthodontists approaching the age of retirement increases.
We found no significant difference between the sexes in the number of weeks worked per year. However, the number of leaves of absences during a career was significantly different. Although the average length of a leave of absence was 9.6 weeks for men and 17.4 weeks for women, this difference was not significant, likely because of the large standard error in number of weeks taken for a leave.
The most common reason for women taking a leave of absence was maternity, while for men it was personal illness. Of interest, 86% of women reported having at least 1 child, while only 44% reported having taken a leave of absence over their career. This may indicate that women either have their children before or during their orthodontic training or take a shorter amount of time away for work and view it as a "vacation" rather than a leave of absence. The results of our study were comparable to similar surveys assessing work patterns of orthodontists in the United States and United Kingdom.12,14
We found that having children, regardless of whether they live at home, did not affect the work patterns of orthodontists in Canada. This is not supported by the literature. In the United States, having children has been found to have an opposite effect on the work patterns of men and women: female orthodontists with children were found to work fewer days per week than childless women and all men, and men with 3 or more children were found to see more patients per day and start more cases per year than men with fewer children and all women.14 Similarly, having young children (under the age of 18) affected the number of hours worked per week differently for male and female dentists in the United States: for women, it decreased the number of hours worked per week by 7 h and, for men, increased that time by 1 h.20
The results of this survey provide weak evidence that men work 3 additional hours a week than their female colleagues. The practical significance of this finding cannot be determined. As there were no significant differences between the sexes for number of case starts per year, number of days worked per week, number of weeks worked per year and other work pattern and practice productivity variables, it is assumed that the difference of 3 h worked per week has minimal practical significance. However, our results were similar to the findings of Walton and colleagues,20 who analyzed the number of hours worked per week by dentists in the United States. They found that women worked 5 fewer hours a week than their male colleagues when age and children living at home were controlled. Studies that examined the work patterns of orthodontists in the United Kingdom produced similar results12,13,16; there, men worked 0.6–1.5 more sessions (1 session = 3.5–4 h) a week than their female colleagues.
In evaluating differences in work patterns, we found that a quadratic relation exists between age and both number of hours worked per week and number of phase II case starts per year. For both variables, productivity increases with increasing age until approximately age 50, after which, both decrease with increasing age. Although age explains less than 14% of the variance in hours worked per week (R2 =0.135) and less than 8% of the variance for phase II starts per year (R2 =0.074), these findings are significant, as at least some of the variation in these work patterns can be explained by age. In addition, as the average age of male orthodontists is currently 52 years, this may be an indicator that most male orthodontists are at the peak of their career, and their current practice productivity may begin to decrease in the near future. As the average age of female orthodontists is 46 years, this may be an indicator that most female orthodontists in Canada are currently in their prime practice years, and their practice productivity may increase over the next few years, until they reach their peak performance.
Conclusions
At this time, minor sex-specific differences exist in demographics and work patterns between male and female orthodontists in Canada; however, the long-term impact of these findings and whether these differences have any practical significance have yet to be determined. As female orthodontists' practices were not found to be substantially different from those of men, it is not possible to speculate whether the increasing number of women specializing in orthodontics will influence changes in the profession.
As this is the first survey of its kind in Canada, the results give us an indication of the current demographic and practice patterns of Canadian orthodontists, which can be used as a reference for future comparisons to determine work patterns and trends in the orthodontic workforce. This quantitative research may allow for qualitative gender comparisons in the orthodontic workforce as well as gender comparisons in other areas of practice, such as communication styles, processes and outcomes of care to aid in both postgraduate teaching and in practice.
THE AUTHORS
 |
Dr. Walker is an orthodontist practising in Grand Falls-Windsor, Newfoundland. |
 |
Dr. Flores-Mir is division head, orthodontics director, faculty of medicine and dentistry, University of Alberta, Edmonton, AB. |
 |
Dr. Heo is associate professor, statistics, orthodontics and biomedical research, faculty of medicine and dentistry, University of Alberta, Edmonton, AB. |
 |
Dr. Amin is associate professor, pediatric dentistry, faculty of medicine and dentistry, University of Alberta, Edmonton, AB. |
 |
Dr. Keenan is associate professor and director, community engaged research, faculty of medicine and dentistry, University of Alberta, Edmonton, AB |
Correspondence to: Dr. Stephanie Walker, 7 Pinsent Dr., Grand Falls-Windsor, NL A2A 2S8. Email: slwalker@ualberta.ca
The authors have no declared financial interests.
This article has been peer reviewed.
References
- 2006 Census. Occupation — national occupational classification for statistics 2006 (720), class of worker (6) and sex (3) for the labour force 15 years and over. Catalogue no. 97-559-XCB2006011. Ottawa: Statistics Canada; 2008.
- 2011 National Household Survey. Occupation — National occupational classification (NOC) 2011 (691), class of worker (5), age groups (13B) and sex (3) for the employed labour force aged 15 years and over, in private households of Canada, provinces, territories, census metropolitan areas and census agglomerations. Catalogue no. 99-012-X2011033. Ottawa: Statistics Canada; 2013.
- Gottlieb EL, Vogels DS, Domer LR, Johnson DA. JCO Orthodontic Practice Study: Economics and Practice Administration. Boulder (CO): Index Publishers Corporation; 1982.
- Keim RG, Gottlieb EL, Nelson AH, Vogels DS 3rd. 2005 JCO Orthodontic Practice Study. Part 4: additional breakdowns. J Clin Orthod. 2006;40(2):95-103.
- Keim RG, Gottlieb EL, Nelson AH, Vogels DS 3rd. 2007 JCO Orthodontic Practice Study. Part 4: additional breakdowns. J Clin Orthod. 2008;42(1):19-27.
- Keim RG, Gottlieb EL, Nelson AH, Vogels DS 3rd. 2009 JCO Orthodontic Practice Study. Part 4: additional breakdowns. J Clin Orthod. 2010;44(1):19-27.
- Keim RG, Gottlieb EL, Nelson AH, Vogels DS 3rd. 2011 JCO Orthodontic Practice Study. Part 4: additional breakdowns. J Clin Orthod. 2012;46(1):15-23.
- 1999-2000 survey of advanced dental education. Chicago: American Dental Association; 2001.
- 2010-11 survey of advanced dental education. Chicago: American Dental Association; 2012. Accessed 2016 Feb 26. Available: http://www.ada.org/~/media/ADA/Member%20Center/FIles/survey_advanced_ed.ashx
- Noble J, Hechter FJ, Karaiskos NE, Wiltshire WA. Resident evaluation of orthodontic programs in Canada. J Dent Educ. 2009;73(2):192-8.
- Turpin DL. Are there enough of us to do the job? Am J Orthod Dentofac Orthop. 2001;120(6):575.
- Collins JM, Cunningham SJ, Moles DR, Galloway J, Hunt NP. Factors which influence working patterns of orthodontists in the United Kingdom. Br Dent J. 2009;207(1):E1; discussion 30-1.
- Collins JM, Hunt NP, Moles DR, Galloway J, Cunningham SJ. Changes in the gender and ethnic balance of the United Kingdom orthodontic workforce. Br Dent J. 2008;205(6):E12.
- Blasius JJ, Pae EK. Work-pattern differences between male and female orthodontists. Am J Orthod Dentofacial Orthop. 2005;128(3):283-90.
- Rea LM, Parker RA. Determining the sample size. In: Designing and conducting survey research. A comprehensive guide. 3rd ed. San Francisco: Jossey-Bass; 2005. pp. 142-56.
- Murphy TC, Parkin NA, Willmot DR, Robinson PG. The feminisation of the orthodontic workforce. Br Dent J. 2006;201(6):355-7.
- de Wet E, Truter M, Ligthelm AJ. Working patterns of male and female dentists in South Africa. J Dent Assoc S Afr. 1997;52(1):15-7.
- Bogardus AJ, Neas BR, Sullivan SM. Practice differences between male and female oral and maxillofacial surgeons: survey results and analysis. J Oral Maxillofac Surg. 1999;57(10):1239-47; discussion 1248.
- Matthews R, Scully C. Working patterns of male and female dentists in the UK. Br Dent J. 1994;176(12):463-6.
- Walton SM, Byck GR, Cooksey JA, Kaste LM. Assessing differences in hours worked between male and female dentists: an analysis of cross-sectional national survey data from 1979 through 1999. J Am Dent Assoc. 2004;135(5):637-45.
- Ayers K, Thomson WM, Whyman RA, Rich AM, Newton JT. Changes in the New Zealand dentist workforce over a nine-year period. N Z Dent J. 2008;104(1):19