Abstract
Background:
The incidence of oropharyngeal cancer (OPC) related to human papillomavirus (HPV) has increased significantly in North America. Identifying high-risk individuals can guide preventive efforts. However, OPC risk prediction models validated for the Canadian population are lacking. This study aimed to externally validate an existing OPC risk prediction model developed in the United States using a Canadian dataset and to assess its performance.
Methods
The model was validated using data from the HeNCe Life study, a hospital-based case–control study on the causes of head and neck cancer. The dataset comprised 214 cases of oropharyngeal squamous cell carcinoma and 433 controls frequency-matched by age and sex, recruited from 4 referral hospitals in Montreal. Participants were 30 to 79 years of age. Predictors included age, sex, race, lifetime smoking history, previous year’s consumption of alcohol, number of lifetime sex partners, HPV infection, and interactions between the number of sex partners and HPV infection, as well as between smoking and HPV infection. Model performance was assessed using various metrics and plots.
Results:
The model showed above-average overall performance (Somers delta score, 0.49; scaled Brier score, 68.8%; Nagelkerke R2, 0.2) and discrimination (concordance statistic, 0.74; discrimination slope, 0.18), but calibration was suboptimal (calibration-in-the-large, 4.93; calibration slope, 0.57).
Conclusions:
The model’s overall predictive performance was above-average;however, the calibration was suboptimal. Therefore, recalibration using a Canadian dataset is warranted. Further studies are required to refine the model for Canadian populations.
Keywords:
Oropharyngeal neoplasms, Risk assessment, Validation studies, Carcinoma, squamous cell, Human papillomavirus infection.
Introduction
Head and neck cancers (HNCs) rank among the malignancies with the highest mortality rates.1 In 2022, an estimated 2100 of the 7500 Canadians who received a diagnosis of HNC died from the disease.2 Despite global efforts to control HNCs,3,4 the incidence of oropharyngeal cancer (OPC), a specific subsite of HNC, has substantially increased over recent decades, particularly in high-income countries such as Canada.2,5 Although smoking and alcohol consumption are well-established risk factors for OPC,6,7 the primary driver behind this increase in Canada is infection with human papillomavirus (HPV),8,9 which exhibits pronounced sex- and birth cohort–specific trends in Western countries, with younger men being the most affected group.10 For example, the age-standardized incidence of HPV-related OPC in Canada increased more than 60% from 1992 to 2009.11
More than 200 distinct types of HPV have been identified,12 yet only a subset (i.e., HPVs 16, 18, 31, 33, 35, 39, 45, 51, 52, 56, 58, 59) are associated with an elevated risk of HPV-related OPC.13 Among these, HPV 16 is the most prevalent type detected in OPC tumour samples.9,14 Early detection of OPC is crucial for improving survival.15-17 However, the initial disease stage is often asymptomatic, and the oropharyngeal area is not easily visualized, factors that pose challenges for early diagnosis, even with careful screening during dental visits.18 Therefore, preventive interventions, including risk assessment to identify high-risk individuals, target preventive education and assign individuals for more frequent and careful screening, are important for reducing both HPV-related and overall OPC mortality.19 Oral health professionals play a pivotal role in preventing HPV-related OPC by identifying patients with high-risk behaviours—such as having multiple sexual partners—and guiding them through behavioural interventions and risk-reduction education.20 These professionals may also encourage high-risk patients to receive HPV vaccination or prescribe molecular HPV testing in suspicious cases. With regular access to their patients, dental providers can implement structured screening protocols and closely monitor high-risk individuals to advocate treatment of precancerous changes before malignant transformation of a suspicious lesion.21 Nonetheless, the first step for an oral health professional wishing to implement these measures is to apply a tool—specifically, a risk prediction model—to properly assess each patient’s risk of OPC.
To date, only one HNC diagnostic risk prediction model (referred to hereafter, for reasons of simplicity, as a risk prediction model) has been published,22 covering populations of European descent in the United States, Canada and Europe. However, this model, which predicts overall HNC risk, does not fully account for the distinct etiological factors of HPV-related OPC, such as sexual behaviours. Furthermore, the use of genetic markers in the model reduces its potential for clinical application, as genetic testing is not yet a routine screening practice for OPC. In 2019, Tota and colleagues13 published an OPC risk prediction model that has been validated in a US sample. This model may be applicable to the Canadian context, but external validation is needed to confirm its accuracy before it can be applied to a different population.23,24 Therefore, this study aimed to externally validate the OPC risk prediction model using data from a Canadian population sample and to assess the model’s performance in this population.
Methods
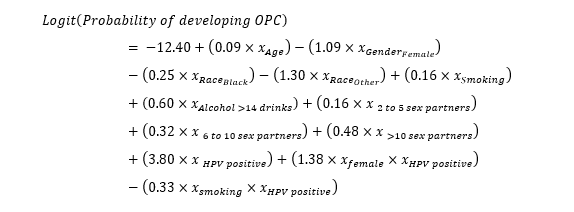
Details about the model of Tota and colleagues are published elsewhere.13 Briefly, these authors developed a multivariable logistic regression model using data from a synthetic case–control study that involved weighted oversampling of 241 incident OPC cases from the Ohio State University Comprehensive Cancer Center (2011–2015) and 9327 US population-representative controls from participants in the National Health and Nutrition Examination Survey (NHANES) (2009–2014).25 Predictors included age, sex, race, pack-years of smoking, previous year’s alcohol consumption, number of lifetime sex partners, HPV infection status, interaction between sex and HPV infection status, and interaction between smoking and HPV infection status. To avoid overfitting, the model was internally validated using the split-sample technique, whereby the initial dataset was divided randomly into 2 sets, designated for training (i.e., 70% of the initial dataset) and testing (i.e., the remaining 30% of the initial dataset). The model was developed using the training dataset and tested with the testing dataset to evaluate accuracy and internal calibration. The model was also externally validated (tested) on 116 OPC cases from Johns Hopkins University historical series26,27 and 3237 controls from NHANES (2013–2014).25
To validate the model in the Canadian context, we used data from the HeNCe Life study, a hospital-based case–control study conducted at 4 major HNC referral hospitals in Montreal between 2005 and 2013.8,9
Sample size
The minimum sample size was estimated following the method published by Riley and colleagues,28 using the following equation:
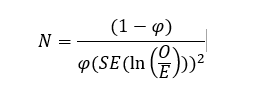
where SE is the standard deviation for ln(O/E), with O/E referring to the observed-to-expected ratio, ideally equal to 1, and φ represents the outcome event proportion (0.478 in the validation dataset). We aimed for a 95% confidence interval (CI) of 0.2 for O/E to ensure good calibration-in-the-large in the external validation. Therefore, we needed a minimum overall sample size of 448 participants, with at least 214 cases (events) to achieve acceptable external validation and good calibration-in-the-large.
Study participants
The participants in the original HeNCe Life study ranged in age from 25 to 93 years. To align with the age range considered in the study by Tota and colleagues,13 a subset of participants (n = 647) aged 30 to 79 years was selected. This subset comprised 214 consecutive incident cases with a histological diagnosis of squamous cell carcinoma (SCC) at the base of the tongue, soft palate, palatine tonsils, oropharynx or uvula (based on International Statistical Classification of Diseases and Related Health Problems, 10th Revision, codes C01, C02.4, C05.01, C05.2, C09, C10, C12 and C14). Cases were diagnosed, according to the standard definition of SCC of the US National Cancer Institute,29 by expert histopathologists who had no access to participants’ demographic and behavioural characteristics.
Controls (n = 433), recruited within 3 months of enrolment of the corresponding case participants, were frequency-matched to the cases by sex and age (5-year categories). They were randomly selected from outpatient clinics unrelated to smoking and alcohol use in the same referral hospitals from which the cases were drawn. The study eligibility criteria were as follows: born in Canada; English- or French-speaking; age 18 years or older; no history of cancer, immunosuppressive condition or mental disorder; and residence within a 50-km distance from one the referral hospitals.
Data collection
During the HeNCe Life study, semistructured one-on-one interviews were used to collect information on an array of exposures, specifically sociodemographic and behavioural characteristics (e.g., age, sex, race, lifetime number of sex partners, lifetime exposure to tobacco smoking and previous-year alcohol consumption). To avoid recall bias, the interviews were based on a questionnaire using the life grid technique, which is a structured interviewing method that uses major chronological life events (e.g., entering college, birth of the first child or marriage) to help participants link the questions with their personal past events and easily recall their former behaviours (e.g., daily number of cigarettes consumed when they married).30 Oral samples were collected using oral rinse and oral brush protocols for detection of HPV DNA. Detection and genotyping of HPV was done using the Linear Array assay (Roche Molecular Diagnostics, Laval, QC). DNA quality was assessed via polymerase chain reaction for the human β-globin gene. Samples negative for β-globin were deemed inadequate. β-Globin–positive samples were then tested for HPV using PGMY09/11 primers.31 Details of these analyses are published elsewhere.8,9
Data analysis
Covariates were analyzed in alignment with the study by Tota and colleagues.13 Age was treated as a continuous variable. Lifetime number of sex partners (categorized as < 2 partners, 2–5 partners, 6–10 partners or > 10 partners), race (i.e., White, Black or other) and HPV status (i.e., high-risk HPV negative [specifically, HPV types 16, 18, 31, 33, 35, 39, 45, 51, 52, 56, 58 or 59] or high-risk HPV positive) were all nominal variables.
To measure lifetime tobacco smoking, we calculated the cumulative number of packs of standardized cigarettes, based on the estimated tobacco content of different smoking products. Accordingly, one pack of standardized cigarettes was considered equal to 20 commercial filtered or unfiltered cigarettes, 5 pipes, 4 hand-rolled cigarettes or 4 cigars.32 The daily number of packs smoked was multiplied by the number of smoking years to obtain lifetime exposure to tobacco smoking, measured in pack-years, which was then converted to log form.
Previous-year alcohol consumption was determined by considering the ethanol concentration of each alcoholic beverage and summing the volume of ethanol exposure (in millilitres) within the year before recruitment. The volume was converted to “number of drinks” by dividing the number of millilitres by 17.05, based on the standard amount of ethanol per drink in Canada.33 This variable was then dichotomized into “≤ 14 drinks per week” and “> 14 drinks per week.”
Based on the study by Tota and colleagues,13 the model was replicated as follows:
Assessment of model performance
We adhered to the framework proposed by Steyerberg and colleagues34 for assessing model performance, which encompasses 3 main components: overall performance, discrimination and calibration. Discrimination measures a model’s ability to distinguish between individuals with and without the outcome (in this case, OPC), whereas calibration assesses the accuracy and reliability of the model’s predictions.
To evaluate overall performance, we calculated the Somers delta (Somers D) score, the scaled Brier score and the Nagelkerke R2. Discrimination was assessed using the concordance statistic (c-statistic) and the discrimination slope. The discrimination slope quantifies the absolute difference in mean predicted probabilities between individuals with and without the outcome. Its theoretical range is between 0 and 1, where 0 indicates no separation and 1 indicates perfect separation. Although there are no universally accepted cutoffs, a discrimination slope of approximately 0.05–0.10 suggests small separation, 0.10–0.20 modest separation, 0.20–0.40 good separation, and values greater than 0.40 indicate strong separation. A receiver operating characteristic (ROC) curve was also plotted. Calibration was evaluated through a smoothed calibration plot obtained using the loess algorithm35 by means of the “val.prob” function of the “rms” (Regression Modeling Strategies) software package within R (version 6.3.0, 2022; R Foundation), which provided values of calibration-in-the-large (intercept) and calibration slope. Additionally, the Hosmer–Lemeshow test was performed to further evaluate the calibration.
All analyses were performed in R software (version 4.2.0; R Foundation). This study was conducted and reported in accordance with the TRIPOD checklist for prediction model development or validation.36
Results
Table 1 presents the characteristics of the validation dataset from the HeNCe Life study. Participants were predominantly male, and the age distribution was similar between cases (59.2 years, standard deviation [SD] 8.9 years) and controls (60.2 [SD 9.9] years). Although smoking amount was slightly higher among cases, alcohol consumption was comparable between the 2 groups. In addition, cases had, on average, a higher number of lifetime sex partners and a greater prevalence of high-risk HPV infection than controls. Missing data were observed only for the HPV variable (7.0% overall), with a higher prevalence of missing data for this variable among cases (13.6%) than controls (3.7%).
Table 2 presents the detailed assessment of the model’s performance. Overall performance was above the medium level, indicated by a Somers D score of 0.49 and a scaled Brier score of 68.8%. Although the c-statistic exceeded 0.7 (Figure 1), the discrimination slope of 0.18 suggested suboptimal distinction between individuals with and without the outcome (Figure 2).
Figure 3 displays the calibration plot of the model using the validation data. The calibration-in-the-large value of 4.93 (95% CI 4.71–5.16) indicates systematic overestimation of predictions. The calibration slope was 0.57 (95% CI 0.45–0.68). This deviation from the ideal calibration (where calibration slope = 1) indicates miscalibration of the model on the validation dataset.
|
Characteristics |
Study group; no. (%) of participantsa |
||
|---|---|---|---|
|
Cases (n = 214) |
Control (n = 433) |
Total (n = 647) |
|
|
Note: HPV = human papillomavirus, SD = standard deviation. |
|||
| Age | |||
| Mean ± SD | 59.2 ± 8.9 | 60.2 ± 9.9 | 59.8 ± 9.6 |
| Range | 32.0–79.0 | 30.0–79.0 | 30.0–79.0 |
| Sex | |||
| Male | 159 (74.3) | 304 (70.2) | 463 (71.6) |
| Female | 55 (25.7) | 129 (29.8) | 184 (28.4) |
| Race | |||
| White | 213 (99.5) | 428 (98.8) | 641 (99.1) |
| Black | 1 (0.5) | 2 (0.5) | 3 (0.5) |
| Other | 0 (0.0) | 3 (0.7) | 3 (0.5) |
| Smoking (pack-years) | |||
| Never | 49 (22.9) | 114 (26.3) | 163 (25.2) |
| ≤ 20 | 60 (28.0) | 130 (30.0) | 190 (29.4) |
| > 20 | 105 (49.1) | 189 (43.6) | 294 (45.4) |
| Alcohol (drinks per week) | |||
| ≤ 14 | 189 (88.3) | 375 (86.6) | 564 (87.2) |
| > 14 | 25 (11.7) | 58 (13.4) | 83 (12.8) |
| Lifetime sexual partners | |||
| 0 or 1 | 11 (5.1) | 32 (7.4) | 43 (6.6) |
| 2–5 | 56 (26.2) | 184 (42.5) | 240 (37.1) |
| 6–10 | 64 (29.9) | 88 (20.3) | 152 (23.5) |
| > 10 | 83 (38.8) | 129 (29.8) | 212 (32.8) |
| HPV statusb | |||
| High-risk negative | 80 (37.4) | 385 (88.9) | 465 (71.9) |
| High-risk positive | 105 (49.1) | 32 (7.4) | 137 (21.2) |
| Missing | 29 (13.6) | 16 (3.7) | 45 (7.0) |
|
Performance metrica |
Score |
|---|---|
|
Note: CI = confidence interval. |
|
| Overall performance | |
| Somers D | 0.49 |
| Brierscaled | 68.8% |
| Nagelkerke R2 | 0.21 |
| Discrimination | |
| c-statistic | 0.74 (95% CI 0.69–0.79) |
| Discrimination slope | 0.18 |
| Calibration | |
| Calibration-in-the-large (intercept) | 4.93 (95% CI 4.71–5.16) |
| Calibration slope | 0.57 (95% CI 0.45–0.68) |
| H–L test | Χ2 29 275.7, p < 0.001 |
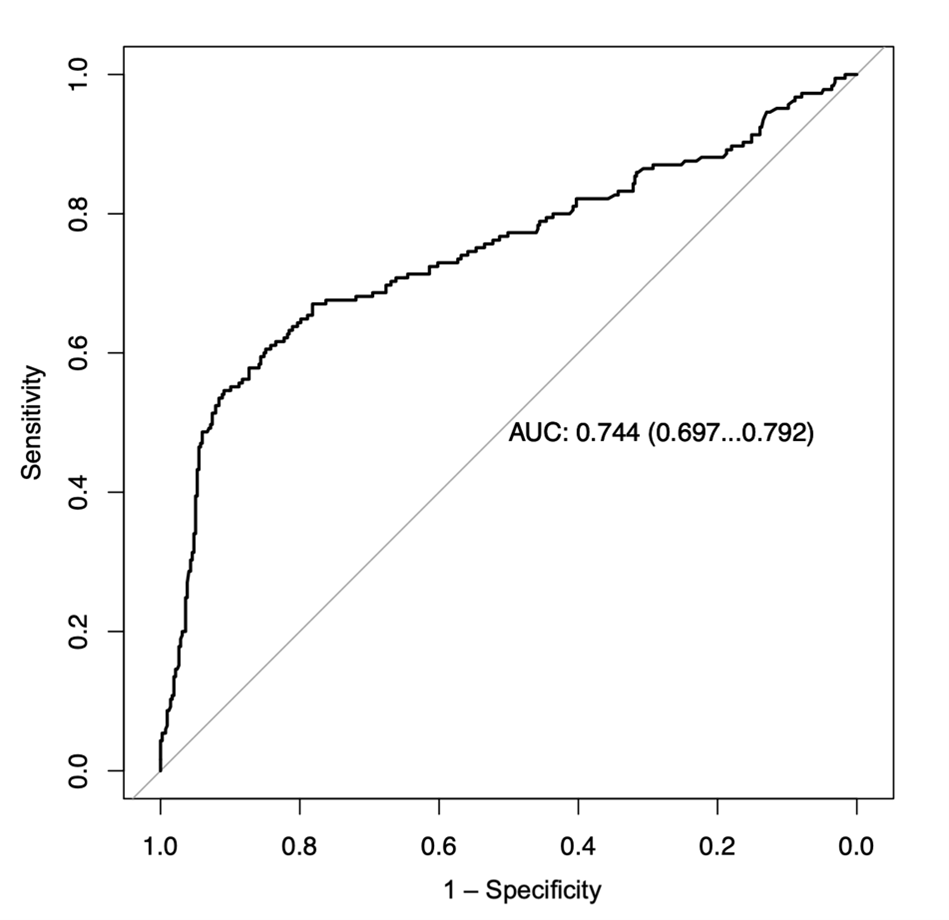
Figure 1: Receiver operating characteristic (ROC) curve for the model in the validation dataset (n = 647 participants). AUC = area under the ROC curve, with 95% confidence interval. Note: AUC corresponds to c-Statistic as the models’ outcome variable is binary.
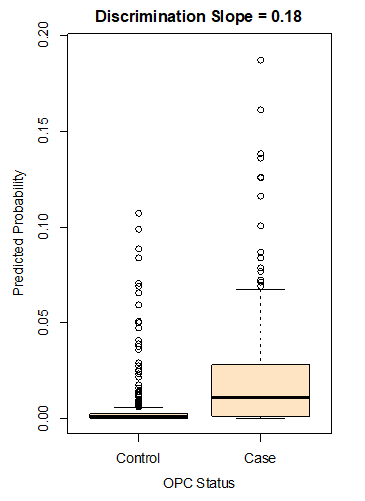
Figure 2: Box plot related to the model’s predicted probabilities among cases and controls. The discrimination slope presents the difference between the mean predicted probability for the 2 groups. Note: OPC = oropharyngeal cancer.
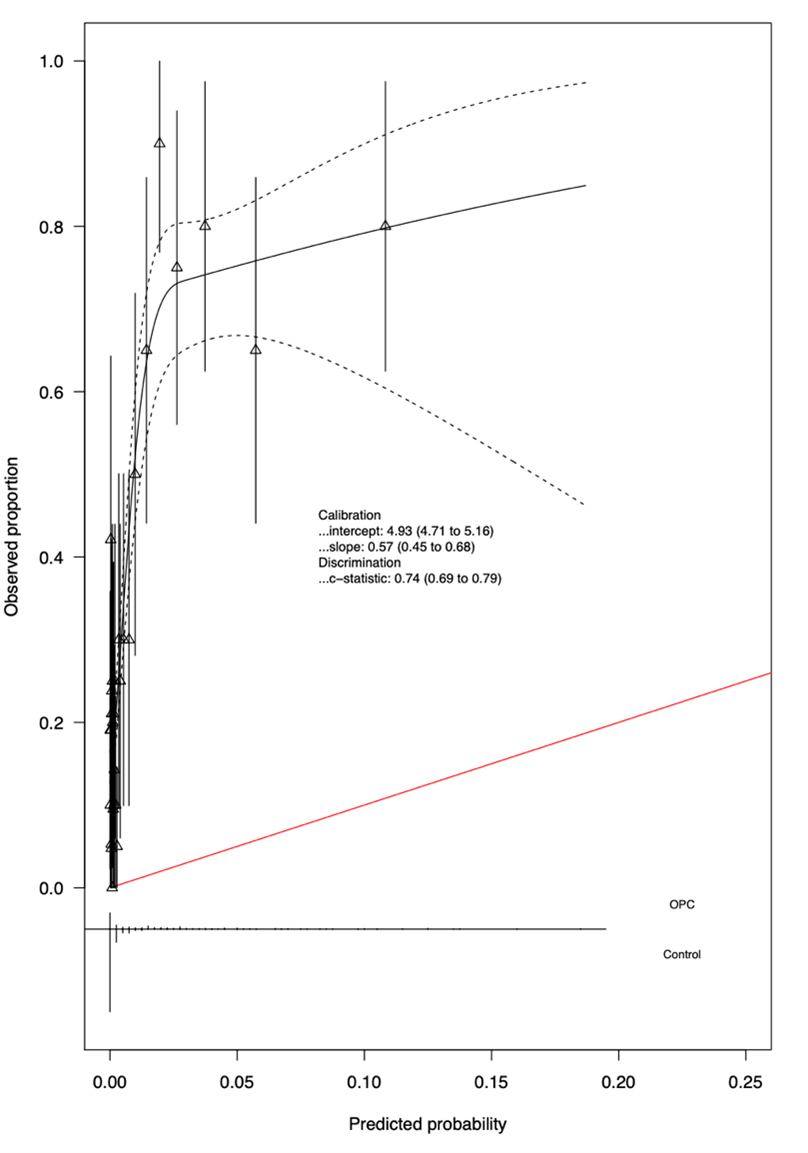
Figure 3: Calibration plot for the model based on the validation data. For each calibration value, the 95% confidence interval is shown. The red diagonal line represents perfect calibration, where the predicted probabilities exactly match the observed proportions. Deviations of the calibration curve from this line indicate miscalibration of the model.
Discussion
In this study, we examined the external validity, in the Canadian context, of a risk prediction model developed by Tota and colleagues.13 The selection of this model was motivated by the rising incidence of OPC in both the United States and Canada, particularly among young men.16,37 In addition, evidence from a systematic review published in 2015 highlighted the comparable prevalence of HPV infection among OPC cases in the 2 countries.38
Our findings indicated suboptimal calibration of the model. The calibration-in-the-large value further suggested miscalibration of the model, which may stem from differences in baseline OPC risk (i.e., the risk of OPC occurring among people with the lowest levels of risk factor exposure)23 between populations due to temporal and geographical heterogeneity. Studies have reported that factors outside the model, such as disease prevalence or baseline risk, can contribute to the mean difference in predicted probabilities derived from a model.40 Due to the lack of information on the incidence of OPC alone in the Canadian population,2 it is challenging to calculate the baseline risk for the HeNCe Life study population. However, the calibration-in-the-large value derived from our study still offers insights for updating the model in future research. Adjusting for baseline risk and addressing the amount of miscalibration may also enhance the model’s predictive performance in future applications.
Several study limitations warrant consideration. First, we did not perform recalibration before assessing model performance. This decision was made to better understand the model’s inherent strengths and limitations that should be addressed in future studies. This approach will also enable comparison of the model’s performance before and after any future update. Second, the HeNCe Life study comprised only a small fraction of the Canadian population living in the province of Quebec. Additionally, the selection of controls from outpatient clinics unrelated to smoking and alcohol may have excluded smokers and heavy alcohol drinkers. Although the distribution of these risk factors in the control group was similar to that of the Quebec population,41,42 broader generalizability across Quebec or Canada may be limited. Third, the absence of HPV status for 7% of the overall sample (i.e., missing values) could potentially reduce the actual sample size, especially among the cases, of which 13.6% were missing data for this variable. This situation may have introduced bias in the estimation of the effect size; however, this variable was complete for most (93%) of the participants, which preserves enough statistical power to at least assess the model’s overall performance. Future studies could further explore this issue using techniques such as sensitivity analysis, inverse probability weighting or multiple imputation by chained equations. Nonetheless, HPV status remains the strongest predictor in this model, and including it in the model—even with the aforementioned limitation—provides valuable insights into the model’s external performance. Lastly, validating risk prediction models in case–control studies is subject to recall bias.43 However, the HeNCe Life study used the life grid technique, which can minimize recall bias in a retrospective study setting.8,44
In spite of these limitations, this study also had several strengths. To our knowledge, it is the first study to validate a risk prediction model specifically for OPC in a Canadian population. Despite the increasing burden of HPV-related OPC in North America, Canada lacks a dedicated OPC risk prediction tool within its health care system. Our findings could lay the groundwork for developing tailored models across diverse Canadian settings. In addition, the sufficient sample size of the HeNCe Life study ensured unbiased model predictions, aligning with the recommendation of at least 100 cases for validation studies.45-47 Comprehensive evaluation metrics, including overall performance, discrimination and calibration, provided an understanding of the model’s strengths and limitations, as well as its implications for clinical practice. Visualization tools, such as the ROC curve and calibration plot, further contributed to assessing the model’s discriminative performance and calibration.
Conclusion
The OPC risk prediction model demonstrated above-average overall performance and calibration, although its capacity for discrimination was above average. Recalibration or redevelopment of the model with specificity to the Canadian populace is recommended before any assessment of its clinical utility.
THE AUTHORS
 |
Dr. Ghanati is an MSc graduate student in the faculty of dental medicine and oral health sciences, McGill University, Montreal, Quebec. |
 |
Dr. Nicolau is professor in the faculty of dental medicine and oral health sciences, McGill University, Montreal, Quebec. |
 |
Dr. Ying is PhD graduate student in the faculty of dental medicine and oral health sciences, McGill University, Montreal, Quebec. |
 |
Dr. Koushik is professor in the faculty of health science, faculty of medicine, division of cancer epidemiology, McGill University, Montreal, Quebec. |
 |
Dr. Madathil is assistant professor in the faculty of dental medicine and oral health sciences, McGill University, Montreal, Quebec. |
Corresponding author: Dr. Sreenath Madathil, Faculty of Dental Medicine and Oral Health Sciences, McGill University, 2001 Avenue McGill College, Montreal, QC, H3A 1G1. Email: sreenath.madathil@mcgill.ca
The authors have no declared financial interests.
This article has been peer reviewed.
Acknowledgements
The authors thank the participants in the HeNCe Life study, as well as the collaborators and research staff who contributed greatly to the study.
References
- Marcu LG, Yeoh E. A review of risk factors and genetic alterations in head and neck carcinogenesis and implications for current and future approaches to treatment. J Cancer Res Clin Oncol. 2009;135:1303-14. doi: 10.1007/s00432-009-0648-7
- Lee S. Cancer statistics. Toronto (ON): Canadian Cancer Society; 2022. Available: https://cancer.ca/en/research/cancer-statistics/past-editions (accessed 2026 March 05).
- Fagan JJ, Noronha V, Graboyes EM. Making the best of limited resources: Improving outcomes in head and neck cancer. Am Soc Clin Oncol Educ Book. 2021;41:279-89. doi: 10.1200/EDBK_320923
- Lo Nigro C, Denaro N, Merlotti A, Merlano M. Head and neck cancer: Improving outcomes with a multidisciplinary approach. Cancer Manag Res. 2017;9:363-71. doi: 10.2147/cmar.S115761
- Chaturvedi AK, Anderson WF, Lortet-Tieulent J, Curado MP, Ferlay J, Franceschi S, et al. Worldwide trends in incidence rates for oral cavity and oropharyngeal cancers. J Clin Oncol. 2013;31(36):4550-9. doi: 10.1200/JCO.2013.50.3870
- Anderson KS, Dahlstrom KR, Cheng JM, Alam R, Li G, Wei Q, et al. HPV16 antibodies as risk factors for oropharyngeal cancer and their association with tumor HPV and smoking status. Oral Oncol. 2015;51(7):662-7. doi: 10.1016/j.oraloncology.2015.04.011
- Gormley M, Dudding T, Sanderson E, Martin RM, Thomas S, Tyrrell J, et al. A multivariable Mendelian randomization analysis investigating smoking and alcohol consumption in oral and oropharyngeal cancer. Nat Commun. 2020;11:6071. doi: 10.1038/s41467-020-19822-6
- Laprise C, Madathil SA, Schlecht NF, Castonguay G, Soulieres D, Nguyen-Tam PF, et al. Increased risk of oropharyngeal cancers mediated by oral human papillomavirus infection: Results from a Canadian study. Head Neck. 2019;41(3):678-85. doi: 10.1002/hed.25436
- Laprise C, Madathil SA, Schlecht NF, Castonguay G, Soulieres D, Nguyen-Tam PF, et al. Human papillomavirus genotypes and risk of head and neck cancers: Results from the HeNCe Life case–control study. Oral Oncol. 2017;69:56-61. doi: 10.1016/j.oraloncology.2017.03.013
- Gillison ML, Chaturvedi AK, Anderson WF, Fakhry C. Epidemiology of human papillomavirus-positive head and neck squamous cell carcinoma. J Clin Oncol. 2015;33(29):3235-42. doi: 10.1200/JCO.2015.61.6995
- Forte T, Niu J, Lockwood GA, Bryant HE. Incidence trends in head and neck cancers and human papillomavirus (HPV)-associated oropharyngeal cancer in Canada, 1992–2009. Cancer Causes Control. 2012;23(8):1343-8. doi: 10.1007/s10552-012-0013-z
- International Human Papillomavirus (HPV) Reference Center [homepage]. Stockholm (Sweden): Center for Cervical Cancer Elimination. Available: https://www.hpvcenter.se/human_reference_clones/ (accessed 2026 March 05).
- Tota JE, Gillison ML, Katki HA, Kahle L, Pickard RK, Xiao W, et al. Development and validation of an individualized risk prediction model for oropharynx cancer in the US population. Cancer. 2019;125(24):4407-16. doi: 10.1002/cncr.32412
- Tumban E. A current update on human papillomavirus-associated head and neck cancers. Viruses. 2019;11(10):922. doi: 10.3390/v11100922
- American Cancer Society. Survival rates for oral cavity and oropharyngeal cancer. Atlanta (GA): The Society. Available: https://www.cancer.org/cancer/oral-cavity-and-oropharyngeal-cancer/detection-diagnosis-staging/survival-rates.html (accessed 2026 March 05).
- Damgacioglu H, Sonawane K, Zhu Y, Li R, Balasubramanian BA, Lairson DR, et al. Oropharyngeal cancer incidence and mortality trends in all 50 states in the US, 2001–2017. JAMA Otolaryngol Head Neck Surg. 2022;148(2):155-65. doi: 10.1001/jamaoto.2021.3567
- Lechner M, Liu J, Masterson L, Fenton TR. HPV-associated oropharyngeal cancer: Epidemiology, molecular biology and clinical management. Nat Rev Clin Oncol. 2022;19(5):306-27. doi: 10.1038/s41571-022-00603-7
- Bitsch Lauritzen B, Schmidt Jensen J, Gronhoj C, Wessel I, von Buchwald C. Impact of delay in diagnosis and treatment-initiation on disease stage and survival in oral cavity cancer: A systematic review. Acta Oncol. 2021;60(9):1083-90. doi: 10.1080/0284186X.2021.1931712
- Timbang MR, Sim MW, Bewley AF, Farwell DG, Mantravadi A, Moore MG. HPV-related oropharyngeal cancer: a review on burden of the disease and opportunities for prevention and early detection. Hum Vaccin Immunother. 2019;15(7-8):1920-8. doi: 10.1080/21645515.2019
- Arnell TL, York C, Nadeau A, Donnelly ML, Till L, Zargari P, et al. The role of the dental community in oropharyngeal cancer prevention through HPV vaccine advocacy. J Cancer Educ. 2021;36(2):299-304. doi: 10.1007/s13187-019-01628-w
- Kline N, Vamos C, Thompson E, Catalanotto F, Petrila J, DeBate R, et al. Are dental providers the next line of HPV-related prevention? Providers’ perceived role and needs. Papillomavirus Res. 2018;5:104-8. doi: 10.1016/j.pvr.2018.03.002
- Budhathoki S, Diergaarde B, Liu G, Olshan A, Ness A, Waterboer T, et al. A risk prediction model for head and neck cancers incorporating lifestyle factors, HPV serology and genetic markers. Int J Cancer. 2023;152(10):2069-80. doi: 10.1002/ijc.34444
- Steyerberg EW. Clinical Prediction Models: A practical approach to development, validation, and updating [Internet]. Cham: Springer International Publishing; 2019 [cited 2026 Mar 9]. (Statistics for Biology and Health). Available from: http://link.springer.com/10.1007/978-3-030-16399-0 doi: 10.1007/978-3-030-16399-0
- Grant SW, Collins GS, Nashef SAM. Statistical primer: developing and validating a risk prediction model. Eur J Cardiothorac Surg. 2018;54(2):203-8. doi: 10.1093/ejcts/ezy180
- National Health and Nutrition Examination Survey. NHANES questionnaires, datasets, and related documentation. Atlanta (GA): Centers for Disease Control and Prevention; 2018.
- Gillison ML, D’Souza G, Westra W, Sugar E, Xiao W, Begum S, et al. Distinct risk factor profiles for human papillomavirus type 16–positive and human papillomavirus type 16–negative head and neck cancers. J Natl Cancer Inst. 2008;100(6):407-20. doi: 10.1093/jnci/djn025
- D’Souza G, Kreimer AR, Viscidi R, Pawlita M, Fakhry C, Koch WM, et al. Case–control study of human papillomavirus and oropharyngeal cancer. N Engl J Med. 2007;356(19):1944-56. doi: 10.1056/NEJMoa065497
- Riley RD, Debray TPA, Collins GS, Archer L, Ensor J, van Smeden M, et al. Minimum sample size for external validation of a clinical prediction model with a binary outcome. Stat Med. 2021;40(19):4230-51. doi: 10.1002/sim.9025
- National Cancer Institute. Squamous cell carcinoma [definition]. In: Dictionary of cancer terms. Bethesda (MD): The Institute; 2011. Available: https://www.cancer.gov/publications/dictionaries/cancer-terms/def/squamous-cell-carcinoma (accessed 2026 March 05).
- Berney LR, Blane DB. Collecting retrospective data: Accuracy of recall after 50 years judged against historical records. Soc Sci Med. 1997;45(10):1519-25. doi: 10.1016/s0277-9536(97)00088-9
- Coutlee F, Gravitt P, Kornegay J, Hankins C, Richardson H, Lapointe N, et al. Use of PGMY primers in L1 consensus PCR improves detection of human papillomavirus DNA in genital samples. J Clin Microbiol. 2002;40(3):902-7. doi: 10.1128/JCM.40.3.902-907.2002
- Schlecht NF, Franco EL, Pintos J, Kowalski LP. Effect of smoking cessation and tobacco type on the risk of cancers of the upper aero-digestive tract in Brazil. Epidemiology. 1999;10(4):412-8. doi: 10.1097/00001648-199907000-00009
- Low-risk alcohol drinking guidelines. Ottawa (ON): Government of Canada; 2021. Available: https://www.canada.ca/en/health-canada/services/substance-use/alcohol/low-risk-alcohol-drinking-guidelines.html (accessed 2026 March 05).
- Steyerberg EW, Vickers AJ, Cook NR, Gerds T, Gonen M, Obuchowski N, et al. Assessing the performance of prediction models: A framework for traditional and novel measures. Epidemiology. 2010;21(1):128-38. doi: 10.1097/EDE.0b013e3181c30fb2
- Austin PC, Steyerberg EW. Graphical assessment of internal and external calibration of logistic regression models by using loess smoothers. Stat Med. 2014;33(3):517-35. doi: 10.1002/sim.5941
- Moons KGM, Altman DG, Reitsma JB, Ioannidis JPA, Macaskill P, Steyerberg EW et al. Transparent reporting of a multivariable prediction model for individual prognosis or diagnosis (TRIPOD): Explanation and elaboration. Ann Intern Med. 2015;162(1):W1-73. doi: 10.7326/M14-0698
- Ghazawi FM, Lu J, Savin E, Zubarev A, Chauvin P, Sasseville D, et al. Epidemiology and patient distribution of oral cavity and oropharyngeal SCC in Canada. J Cutan Med Surg. 2020;24(4):340-9. doi: 10.1177/1203475420915448
- Stein AP, Saha S, Kraninger JL, Swick AD, Yu M, Lambert PF, et al. Prevalence of human papillomavirus in oropharyngeal cancer: A systematic review. Cancer J. 2015;21(3):138-46. doi: 10.1097/PPO.0000000000000115
- Austin PC, van Klaveren D, Vergouwe Y, Nieboer D, Lee DS, Steyerberg EW. Validation of prediction models: examining temporal and geographic stability of baseline risk and estimated covariate effects. Diagn Progn Res. 2017;1:12. doi: 10.1186/s41512-017-0012-3
- Chan SF, Deeks JJ, Macaskill P, Irwig L. Three methods to construct predictive models using logistic regression and likelihood ratios to facilitate adjustment for pretest probability give similar results J Clin Epidemiol. 2008;61(1):52-63. doi: 10.1016/j.jclinepi.2007.02.012
- Lillard DR, Christopoulou R. Life-course smoking behavior: Patterns and national context in ten countries. Oxford (UK): Oxford University Press; 2015.
- Paradis C, Demers A, Picard E. Alcohol consumption: a different kind of Canadian mosaic. Can J Public Health. 2010;101(4):275-80. doi: 10.1007/BF03405286.44
- Sedgwick P. What is recall bias? BMJ 2012;344:e3519. doi: 10.1136/bmj.e3519
- Madathil SA. Life course behavioural risk factors of head and neck cancers: a Bayesian approach [thesis]. Montreal (QC): McGill University; 2018.
- Van Calster B, Nieboer D, Vergouwe Y, De Cock B, Pencina MJ, Steyerberg EW. A calibration hierarchy for risk models was defined: from utopia to empirical data. J Clin Epidemiol. 2016;74:167-76. doi: 10.1016/j.jclinepi.2015.12.005
- Collins GS, Ogundimu EO, Altman DG. Sample size considerations for the external validation of a multivariable prognostic model: a resampling study. Stat Med. 2016;35(2):214-26. doi: 10.1002/sim.6787
- Vergouwe Y, Steyerberg EW, Eijkemans MJC, Habbema JDF. Substantial effective sample sizes were required for external validation studies of predictive logistic regression models. J Clin Epidemiol. 2005;58(5):475-83. doi: 10.1016/j.jclinepi.2004.06.017