Abstract
Background:
The development of multiple primary tumours (MPTs) is an important consequence of oral cancer and one of the leading causes of mortality among these patients. This study aimed to identify some of the risk factors for MPT development in oral cancer patients and to examine its impact on survival rates.
Methods
In this retrospective, population-based cohort study, we retrieved administrative data from the Alberta Cancer Registry database for 3549 patients diagnosed with primary oral cancer (POC) between 2005 and 2020.
Results:
Among these patients, 513 developed MPTs for an overall incidence of 14.5%. The average time interval for development of the first MPT was 4.04 ± 3.67 years. The proportion of patients with any comorbid conditions was significantly higher in MPT patients compared with non-MPT patients. Advanced age, average income, comorbidities including chronic obstructive pulmonary disease, diabetes and cardiovascular disease, and increased time from diagnosis to treatment were found to be potential risk factors for MPT development. Analysis revealed a sharp decrease in survival rate of oral cancer patients after developing MPTs. Furthermore, age >45 years, body mass index <18.5, synchronous tumours, stage III and IV POC, >2 comorbid conditions and MPT developing in the digestive system were associated with poor disease-specific survival.
Conclusions:
The development of MPTs significantly affects the survival of oral cancer patients. Advanced age, comorbidities and delayed initiation of treatment were identified as key risk factors for MPTs. The poor survival outcomes, particularly in patients with synchronous tumours, advanced-stage primary cancers and specific comorbid conditions, highlight the need for early detection and proactive management strategies to mitigate these risks and improve long-term survival in this population.
Introduction
Oral cancer is a significant public health concern globally. It is the sixth most common cancer in the world, with an annual incidence of approximately 300 000 reported cases, about two-thirds of which are in developing countries.1 According to the Canadian Cancer Society, more cases of oral cancer are diagnosed every year than ovarian or cervical cancer, and its average 5-year survival rate is only 64%.2 Oral cancer is a broad term that includes 2 subcategories: oral cavity cancer (OCC) and oropharyngeal cancer (OPC). Despite the decline in tobacco consumption and a decreasing incidence of other head and neck cancers, the incidence of oral cancer has increased, mainly because of an increase in HPV-associated OPC.3 Patients with HPV-positive OPC have been found to be younger and present clinically with an advanced nodal stage; however, they respond favourably to treatment and have better survival rates than patients with HPV-negative OPC.4
According to an earlier study conducted in Alberta,5 47.9% of patients diagnosed with oral cancer died, indicating a high mortality rate associated with oral cancer. The suggested reasons included late presentation of advanced disease and the risk of MPT development.6 MPTs are defined as the second, third, fourth or even more primary tumours and are not the same as residual/recurrent tumours.7 To identify multiple primary tumours, SEER (surveillance, epidemiology and end results program) considers histologic findings, site, laterality and time since the diagnosis of the primary tumour.8 Population-based studies have documented the incidence of MPTs in oral cancer patients ranging from 3% to 21%.9
An overall poor prognosis and a significant decrease in 5-year survival rates from 69% to 32% have been documented in patients with MPTs compared with patients without MPTs.10 According to a Canadian study, the impact of MPTs on 5-year relative survival is greatest in bladder cancer (−2.4% age-standardized) followed by oral cancer (−1.9%).11 Considering this significant effect of MPTs on the survival rate of oral cancer patients, this study aimed to identify risk factors of MPT development in oral cancer patients and to examine the survival rates of oral cancer patients with MPTs and associated factors. The findings will help inform health care professionals about the group of oral cancer survivors who are at higher risk for developing MPTs and help them carry out preventive strategies including close monitoring and follow-up appointments.
Materials and Methods
Study Population
Using a retrospective, population-based cohort design, we obtained data from the Alberta Cancer Registry (ACR) for Alberta residents diagnosed with primary oral cancer (POC) at age ≥18 years between 2005 and 2020. The data were retrieved on 31 July 2020. The ACR, a population-based registry certified by the North American Association of Central Cancer Registries, maintains comprehensive data on all new cancer diagnoses and deaths in Alberta.
The location of oral cancers was based on the International Classification of Diseases for Oncology (3rd edition, ICD-O-3).12 Patients with MPT were identified from the original cohort.
MPTs were defined according to Warren and Gates criteria.13 Patients who developed second, third, fourth or even more tumours were identified as patients with MPT. MPTs were categorized as synchronous if diagnosed within 6 months of the index tumour and metachronous if diagnosed later.
Data Extraction
Sociodemographic and Clinical Characteristics: Baseline demographics and clinical variables were gathered from patients’ records. Demographic factors included age at diagnosis, gender, year of diagnosis, age at death, vital status and household income. Clinical characteristics included number of SPTs, duration of development of MPT from POC, site distribution of tumour according to ICD-O-3 grading,12 tumour stage as reported in pathology reports according to the American Joint Committee on Cancer, 7th and 8th editions (AJCC 7 and AJCC 8)14,15 and history of medical conditions. Treatment modality factors included surgery, chemotherapy, radiation, immunotherapy and combinations of treatment.
The patients were then divided into 2 groups: patients with POC who developed MPTs and patients who did not develop MPTs. A comparative analysis was carried out to study the demographic and clinicopathological characteristics of both groups. Regression analysis was carried out to determine whether there was an association between risk factors and MPT development.
Outcome Variable (Survival): The vitality status of oral cancer patients was recorded as alive or deceased. The time from diagnosis of POC until date of death was used to calculate survival rate for patients with and without MPTs.
The survival period was up to 15 years if POC was diagnosed in 2005; however, the study endpoints consisted of 5-, 10- and 15-year overall survival rates based on the year of POC diagnosis. Disease-specific survival was calculated for 5 years, comparing the survival rates of patients who developed MPT to those who did not.
Statistical Analyses
Descriptive statistics for demographic and clinical characteristics for all patients and each group were computed. Categorical variables were summarized in frequency and percentages and numerical variables were expressed as mean ± standard deviation (SD) or median interquartile range (IQR) for each group. Comparisons of the demographic and clinical characteristics were made between MPT and non-MPT patients. Chi-squared tests and Fisher exact tests were employed where appropriate for categorical variables. For numerical variables, an independent Student t test was used. To determine the significant prognostic factors associated with the development of MPT, binary logistic regression was used at univariable and multivariable levels. The primary outcome measure was 5-year disease-specific survival. Kaplan-Meier survival curves were plotted to estimate the overall survival of patients with and without MPT. Unadjusted and adjusted hazard ratios were computed using Cox proportional hazard models to present the risk of death. Cox regression analysis is a specific regression model to evaluate the influence of multiple independent variables on survival time (a time to event outcome). Time from a start point (e.g., disease diagnosis) to an event (e.g., death due to the disease) is the main component of Cox regression models.
By using multivariable regression analyses, the relative odds ratios of MPTs for each possible related factor was estimated by adjusting for possible confounding variables. A p value < 0.05 was considered statistically significant. All statistical analyses were performed using statistical software SPSS v. 22.
Ethics Approval
This study was conducted with the approval of the Health Research Ethics Board of Alberta Cancer Committee (HREBA.CC-17-0370) and the University of Alberta. All data were fully anonymized to ensure patient confidentiality.
Results
Sociodemographic Characteristics
Records of 3549 POC patients between 2005 and 2020 were retrieved from the ACR database; 71.8% were males (Table 1). The patients were 18–97 years of age (mean 61 ± 12.5 years). Of the original cohort, 513 (14.5%) patients developed MPTs.
Comparative analyses showed no significant difference in gender distribution between MPT and non-MPT patients (p = 0.36); more males were in both MPT (69.8%) and non-MPT (71.8%) groups. For both groups, the average age at first diagnosis was 61 years (61 ± 12.5 and 61 ± 11.7, respectively). There was no significant difference in body mass index (BMI) of patients in the 2 groups (p = 0.067). However, we found a significant difference in average annual income (p = 0.019): the largest proportion of non-MPT patients (47.2%) had an income >$75 000, while the largest proportion of MPT patients (48.7%) reported an average income of $45 000–75 000. No significant differences between MPT and non-MPT patients were found based on geographic location of diagnosis (p = 0.730).
|
Characteristics |
No. patients (%) |
p* |
|||
|---|---|---|---|---|---|
|
Without MPTs |
With MPTs |
Total |
|||
|
Note: SD = standard deviation. |
|||||
| Gender | 0.360 | ||||
| Male | 2179 (71.8) | 358 (69.8) | 2537 (71.5) | ||
| Female | 857 (28.2) | 155 (30.2) | 1012 (28.5) | ||
| Age at diagnosis, years | <0.001 | ||||
| ≤45 | 288 (9.5) | 19 (3.7) | 307 (8.7) | ||
| 46–65 | 1776 (58.5) | 305 (59.5) | 2081 (58.6) | ||
| >65 | 972 (32.0) | 189 (36.8) | 1161 (32.7) | ||
| Mean ± SD | 61 ± 12.6 | 61 ± 11.7 | 61 ± 12.5 | 0.130 | |
| Body mass index | 0.067 | ||||
| Underweight <18.5 | 124 (4.1) | 21 (4.1) | 145 (4.1) | ||
| Normal range 18.5–24.9 | 859 (28.3) | 172 (33.5) | 1031 (29.1) | ||
| Overweight 25–29.9 | 925 (30.5) | 161 (31.4) | 1086 (30.6) | ||
| Obese ≥30 | 685 (22.6) | 131 (25.5) | 816 (23.0) | ||
| No data available† | 443 (14.6) | 28 (5.5) | 471 (13.3) | ||
| Average annual income, $ | 0.019 | ||||
| <45 000 | 292 (9.6) | 40 (7.8) | 332 (9.4) | ||
| 45 000–75 000 | 1310 (43.1) | 250 (48.7) | 1560 (44.0) | ||
| >75 000 | 1433 (47.2) | 216 (42.1) | 1649 (46.5) | ||
| No data available† | 1 (0.0) | 7 (1.4) | 8 (0.2) | ||
| Diagnosis location | 0.730 | ||||
| Southern Alberta | 229 (7.5) | 44 (8.6) | 273 (7.7) | ||
| Calgary | 1147 (37.8) | 184 (35.9) | 1331 (37.5) | ||
| Central Alberta | 384 (12.6) | 69 (13.5) | 453 (12.8) | ||
| Edmonton | 959 (31.6) | 157 (30.6) | 1116 (31.4) | ||
| Northern Alberta | 317 (10.4) | 54 (10.5) | 371 (10.5) | ||
| No data available† | 0 (0.0) | 5 (1.0) | 5 (0.1) | ||
Clinical Characteristics
Occurrence and Distribution of MPTs: Of the 513 patients with MPTs, 82.8% (n = 425) were diagnosed with 1 MPT 15.6% (n = 80) with 2 MPTs and 1.6% (n = 8) with more than 2 MPTs. It was observed that 77.9% of the MPTs were metachronous and 22.03% were synchronous. The mean time to occurrence of MPTs following the diagnosis of POC was 4.2 ± 3.8 years.
Of 3549 patients with POC, 1712 (48.2%) had OCC, while 1837 (51.8%) had OPC. The proportion of OCC patients who developed MPTs (53.4%) was slightly higher than that of OPC patients who developed MPTs (46.6%) (Table 2a). Of the primary OCC subsites in the study, tongue tumours (37.6%) showed a higher probability of developing MPTs followed by floor of mouth tumours (21.9%). Of the primary OPC subsites in the study, tonsil (48.7%) was the most predominant site to develop MPTs followed by base of tongue (37.6%). The most common site for development of MPT was the oral region (31.8%) followed by lung/bronchus (19.1%), digestive system (12.3%) and head and neck sites other than the oral region (11.3%). A similar pattern was observed for 3rd, 4th and 5th primary tumours (Table 2b).
History of Medical Conditions: The proportion of patients with any comorbid condition was found to be higher among those with MPTs (51.0%) compared with those without MPTs (40.0%). The most prevalent and statistically significant comorbid conditions in MPT patients were chronic obstructive pulmonary disease (COPD, 24.6%, p < 0.001), diabetes (18.7%, p = 0.004) and cardiovascular disease (11.5%, p = 0.040) (Table 3).
|
Location of oral cancer |
No. patients (%) |
p* |
||
|---|---|---|---|---|
|
Without MPTs |
With MPTs |
Total |
||
|
Note: OCC = oral cavity cancer, OPC = oropharyngeal cancer. |
||||
| OCC | 1438 (47.4) | 274 (53.4) | 1712 (48.2) | 0.002 |
| Floor of mouth | 185 (12.9) | 60 (21.9) | 245 (14.3) | |
| Gum | 132 (9.2) | 31 (11.3) | 163 (9.5) | |
| Lip | 49 (3.4) | 9 (3.3) | 58 (3.4) | |
| Mouth, other and unspecified | 236 (16.4) | 49 (17.8) | 285 (16.7) | |
| Palate | 136 (9.5) | 22 (8.0) | 158 (9.2) | |
| Tongue, other and unspecified | 700 (48.7) | 103(37.6) | 803 (47.0) | |
| OPC | 1598 (52.6) | 239 (46.6) | 1837 (51.8) | 0.011 |
| Base of tongue | 591 (37.0) | 90 (37.6) | 681 (37.0) | |
| Lip, oral cavity and pharynx, other and unspecified | 28 (1.8) | 4 (1.8) | 32 (1.7) | |
| Oropharynx | 201 (12.6) | 28 (11.7) | 229 (12.5) | |
| Tonsil | 778 (48.7) | 117 (48.7) | 895 (48.7) | |
|
Site of MPT |
No. patients who developed MPTs (%) |
|||
|---|---|---|---|---|
|
Second |
Third |
Fourth |
Fifth |
|
|
*Χ2 test. |
||||
| Oral cancer | 163 (31.8) | 27 (33.8) | 3 (50.0) | |
| Head and neck | 58 (11.3) | 8 (10.0) | ||
| Digestive system | 63 (12.3) | 8 (10.0) | ||
| Lung/bronchus | 98 (19.1) | 22 (27.5) | 1 (16.7) | 1 (50.0) |
| Breast | 10 (1.9) | 1 (1.25) | ||
| Female genital | 4 (0.8) | |||
| Male genital | 42 (8.2) | 3 (3.8) | 1 (16.7) | |
| Urinary system | 20 (3.9) | 1 (1.3) | 1 (16.7) | |
| Lymphatic/hematopoietic | 31 (6.0) | 6 (7.5) | ||
| Skin | 7 (1.4) | 1 (1.3) | ||
| Other | 10 (2.0) | 1 (50.0) | ||
| Unknown primary | 7 (1.4) | 3 (3.8) | ||
|
Characteristics |
No. patients (%) |
p* |
||
|---|---|---|---|---|
|
Without MPTs |
With MPTs |
Total |
||
|
Note: *Χ2 test or Fisher exact test, as appropriate. |
||||
| Comorbid conditions | ||||
| Cardiovascular disease | 254 (8.4) | 59(11.5) | 313 (8.8) | 0.040 |
| Diabetes | 406 (13.4) | 96 (18.7) | 502 (14.1) | 0.004 |
| Renal failure | 119 (3.9) | 22 (4.3) | 141 (4.0) | 0.560 |
| Chronic obstructive pulmonary disease | 458 (15.1) | 126 (24.6) | 603 (16.6) | <0.001 |
| Cerebrovascular disease | 281 (9.3) | 41 (8.0) | 322 (9.1) | 0.370 |
| Other | 167 (5.5) | 26 (5.1) | 193 (5.4) | 0.540 |
| Type of treatment† | 0.22 | |||
| Surgery | 741 (24.4) | 167 (32.6) | 908 (25.5) | |
| Radiotherapy | 244 (8.0) | 32 (6.2) | 276 (7.6) | |
| Chemotherapy | 4 (0.1) | 1 (0.2) | 5 (0.1) | |
| Surgery + chemotherapy + radiotherapy + immunotherapy | 1 (0.0) | 1 (0.2) | 2 (0.1) | |
| Surgery + chemotherapy + radiotherapy | 379 (12.5) | 77 (15) | 456 (12.8) | |
| Surgery + chemotherapy | 3 (0.1) | 0 (0.0) | 3 (0.1) | |
| Chemotherapy + radiotherapy | 623 (20.5) | 103 (20.1) | 726 (20.4) | |
| Surgery + radiotherapy | 409 (13.5) | 83 (16.2) | 492 (13.8) | |
| Chemotherapy + radiotherapy + immunotherapy | 4 (0.1) | 1 (0.2) | 5 (0.1) | |
| Radiotherapy + immunotherapy | 40 (1.3) | 7 (1.3) | 47 (1.3) | |
| Surgery + immunotherapy | 1 (0.0) | 0 (0.0) | 1 (0.0) | |
| Surgery + radiotherapy + immunotherapy | 9 (0.3) | 1 (0.2) | 10 (0.3) | |
| No treatment | 578 (19.0) | 133 (26) | 711 (20) | |
| Duration from diagnosis to treatment, months | ||||
| 0–3 | 1738 (57.3) | 325 (63.3) | 2063 (58.1) | |
| 3–6 | 652 (21.5) | 131 (25.5) | 783 (22.1) | |
| 6–12 | 65 (2.1) | 16 (3.1) | 81 (2.2) | |
| Staging of oral cancer | Without MPTs (n = 3036) | With MPTs (n = 513) | p | |
| AJCC 7‡ | 0.005 | |||
| I | 315 (12.9) | 80 (17.2) | ||
| II | 178 (7.3) | 41 (8.8) | ||
| III | 212 (8.7) | 48 (10.3) | ||
| IV | 1482 (61.0) | 240 (51.6) | ||
| Unknown | 241 (9.9) | 56 (12.0) | ||
| AJCC 8‡ | 0.535 | |||
| I | 177 (29.1) | 14 (29.2) | ||
| II | 86 (14.1) | 10 (20.8) | ||
| III | 90 (14.8) | 9 (18.7) | ||
| IV | 130 (21.3) | 7 (14.6) | ||
| Unknown | 125 (20.5) | 8 (16.7) | ||
Treatment Modalities: There was no significant difference between the type of treatment received for POC and development of MPTs (p = 0.22). Surgery alone (57.0%) was the most common type of treatment among the entire cohort, followed by chemotherapy plus radiotherapy for both MPT (20.5%) and non-MPT patients (20.1%) (Table 3). Most patients received their first treatments within 3 months of POC diagnosis (58.1%). However, the mean time from diagnosis to treatment was slightly longer for MPT patients compared with non-MPT patients (2.27 vs. 2.19 months, p = 0.090).
Staging of Oral Cancer: According to the American Joint Committee on Cancer’s staging manual, 7th edition (AJCC 7),14 most POC patients were at stage IV regardless of whether they developed MPT or not (51.6% and 61%, respectively). Based on AJCC 8,15 there was no significant difference between the 2 groups (p = 0.535; Table 3).
Regression Analysis
The univariable analysis identified the following factors to be significantly associated with an increased risk of MPT development: age > 45 years (p < 0.001); average annual income $45 000–$75 000 (p = 0.019); POC with 2 comorbid conditions (p < 0.001) including cardiovascular disease (p = 0.022), diabetes (p < 0.001) and COPD (p < 0.001); and increasing time from diagnosis to treatment (p < 0.001; Table 4). However, stage IV POC was found to be inversely associated with the development of MPT (p = 0.048).
After including the potential significant risk factors from univariable analysis in the multivariable model, all these variables retained their independent prognostic significance in the multivariable model.
|
Variable |
Odds ratio |
p |
Odds risk |
p |
|---|---|---|---|---|
|
Note: CI = confidence interval, COPD = chronic obstructive pulmonary disorder. |
||||
| Age at diagnosis, years | ||||
| 46–65 | 2.4 (1.5-3.7) | <0.001 | 2.3 (1.4-3.9) | <0.001 |
| >65 | 2.6 (1.7-4.1) | <0.001 | 2.4 (1.4-4) | <0.001 |
| Average annual income, $ | ||||
| 45 000–75 000 | 1.2 (1-1.4) | 0.019 | 1.2 (1-1.4) | 0.051 |
| Comorbid conditions | ||||
| 1 | 1.4 (1.2-1.7) | <0.001 | ||
| 2 | 1.8 (1.4-2.3) | <0.001 | 1.4 (0.3-1.8) | 0.005 |
| Cardiovascular disease | 1.3 (1-1.7) | 0.022 | 1.4 (1-1.9) | 0.056 |
| Diabetes | 1.4 (1.1-1.7) | <0.001 | 1.4 (1.1-1.9) | 0.009 |
| COPD | 1.6 (1.4-2) | <0.001 | 1.7 (1.3-2.1) | <0.001 |
| Time from diagnosis to treatment, months | ||||
| 3–6 | 2.4 (1.8-3.3) | <0.001 | 3.7 (2.1-6.7) | <0.001 |
| 6–12 | 2.6 (1.8-3.6) | <0.001 | 3.8 (2.1-7) | <0.001 |
| Cancer stage | ||||
| IV | 0.68 (0.6-1) | 0.048 | 0.8 (0.6-1) | 0.048 |
Survival Analysis
Of 3549 oral cancer patients, only 1963 (55.3%) survived from 2005 to 2020. Those who survived did not develop a secondary tumour, were <45 years, had a BMI >18.5, had no underlying comorbid conditions and their POC was treated during stages I and II.
The 5-year disease-specific survival rate (DSS) for the entire cohort was 71%. The mean number of years of survival of patients after developing MPT was 5.7 (SD 3.8) years compared with 3.0 (4.7) years among non-MPT patients.
Kaplan-Meier Analyses
Kaplan-Meier analysis showed that patients who survived >5 years (9.7%) from the diagnosis of POC had a sharp decrease in 5-year DSS if they developed MPTs (from 70% to 47%, p = 0.004; Figure 1). Furthermore, patients with MPTs in the oral region had better DSS than those with MPTs in the digestive system (oral vs. digestive system: 68% vs. 52%, p = 0.001). The prognosis of MPT patients with synchronous and metachronous tumours was further analyzed. MPT patients with metachronous tumours had significantly higher survival rate than those with synchronous tumours (75% vs. 45%, p < 0.001; Figure 2).
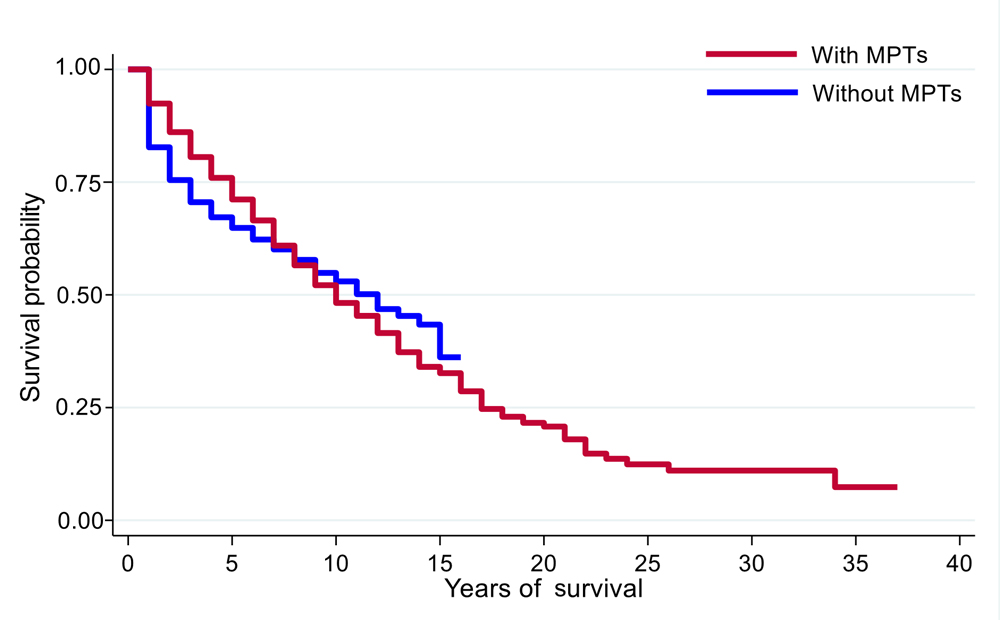
Figure 1: Survival curves for patients with and without multiple primary tumours (MPTs).
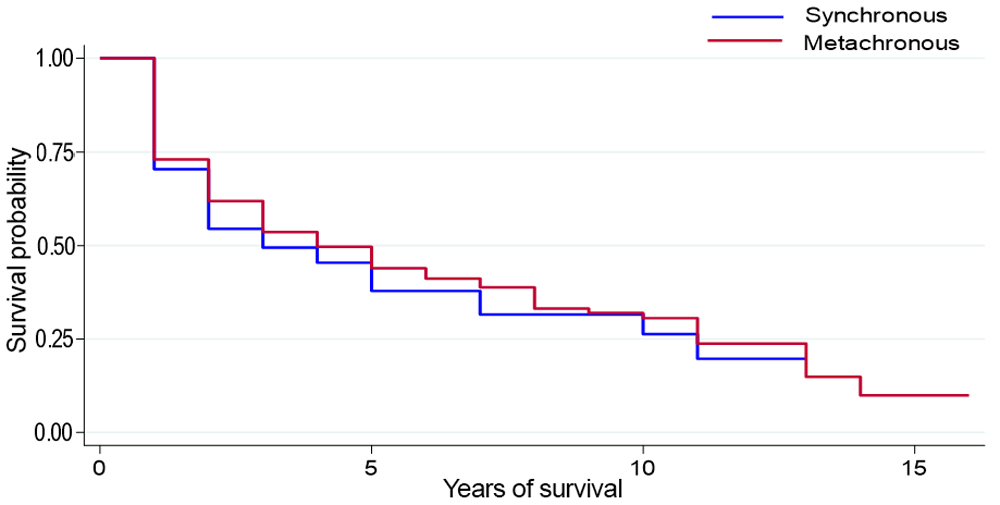
Figure 2: Survival analysis by time to first multiple primary tumour.
Cox Regression Model
Univariable Analysis: Patients >45 years (p < 0.001), BMI <18.5 (p < 0.001) and annual income <$75 000 (p < 0.001) were significantly associated with high risk of death. Patients >65 years had a 2-fold higher risk of death than patients ≤45 years (hazard ratio [HR] 2.9, CI 1.9–3.7, p < 0.001). In addition, an increasing number of comorbid conditions was significantly associated with increasing risk of death. Furthermore, synchronous tumours (p < 0.001), site of POC (p = 0.002) and site of 1st MPT (p < 0.001) were high-risk prognostic factors for DSS in MPT patients. The HRs of MPT cancer stage III and IV were found to be significantly higher than stage I and II: HR 1.9, CI 1.1–3.3, p = 0.027 and HR 2.3, CI 1.5–3.7, p < 0.001, respectively (Table 5).
|
Variable |
Hazard ratio |
p |
Adjusted hazard ratio |
p |
|---|---|---|---|---|
|
Note: AHR = adjusted hazard ratio, CI = confidence interval, COPD = chronic obstructive pulmonary disorder. |
||||
| Age at diagnosis, years | ||||
| 46-65 | 1.8 (1.3–2.5) | <0.001 | 1.6 (1.2–2.2) | <0.001 |
| >65 | 3.2 (2.4–4.4) | <0.001 | 2.9 (1.9–3.7) | <0.001 |
| BMI | ||||
| Underweight <18.5 | 2.5 (1.8–3.6) | <0.001 | 2.2 (1.2–2.9) | <0.001 |
| Normal range 18.5–24.9 | 1.6 (1.2–2.0) | 0.001 | ||
| Average annual income, $ | ||||
| <45 000 | 1.8 (1.5–2.3) | <0.001 | ||
| 45 000–75 000 | 1.4 (1.2–1.6) | <0.001 | ||
| No. comorbid conditions | ||||
| 1 | 1.7 (1.4–1.9) | <0.001 | ||
| 2 | 2.1 (1.7–2.5) | <0.001 | 2.3 (1.6–3.3) | 0.021 |
| >2 | 2.2 (2.7–4.1) | <0.001 | 3.2 (1.8–5.3) | 0.048 |
| COPD | 2.0 (1.7–2.3) | <0.001 | ||
| Time to MPT | ||||
| Synchronous vs. metachronous | 3.1 (2.3–4.2) | <0.001 | 2.6 (1.7-4.1) | <0.001 |
| Site of primary oral cancer | ||||
| Base of Tongue | 2.1 (1.4–4.7) | 0.002 | ||
| Oropharynx | 2.7 (1.3–2.3) | 0.004 | ||
| Tonsil | 1.3 (0.6–2.3) | 0.028 | ||
| Site of 1st MPT | ||||
| Digestive system | 2.1 (1.2–3.5) | 0.003 | 2.1 (1.3–3.6) | 0.048 |
| Lung/bronchus | 2.0 (1.3–3.1) | 0.001 | ||
| Cancer stage | ||||
| III | 1.9 (1.1–3.3) | 0.027 | 2.1 (1.1–3.9) | 0.025 |
| IV | 2.3 (1.5–3.7) | <0.001 | 2.6 (1.5–4.3) | <0.001 |
| Unknown | 1.9 (1.1–3.2) | 0.016 | 2.5 (1.3–4.6) | 0.003 |
Multivariable Analysis: Further analysis showed that age >45 years and BMI <18.5 remained significant prognostic indicators of fatal outcome. Patients who had >2 comorbid conditions along with MPT showed a 3-fold increased risk of death (HR 4.3, CI 0.9–20.8, p = 0.048). Similarly, patients with synchronous tumours had a higher risk of death than those with metachronous tumours (HR 2.6, CI; 1.7-4.1, p < 0.001). In the multivariate model, no POC site remained significant in terms of predicting risk associated with MPT; however, the digestive system as an MPT site remained significant (HR 2.1, CI 1.3–3.5, p = 0.040). In addition, patients with stage III and IV POC and MPTs also remained highly significant as the predictor of death: HR 2.1, CI 1.09–3.9, p = 0.025 and HR 2.6, CI 1.5–4.3, p < 0.001, respectively (Table 5).
Discussion
This population-based retrospective study revealed that 14.5% of oral cancer patients developed MPTs. The incidence of MPTs in previous studies of other populations has been reported to range from 11% to as high as 27%, which is comparable to this study.16-18 In this study, most patients developed MPTs, on average 4.04 years after the diagnosis of POC. This finding is similar to previous studies that reported an average time of 4.5 and 4.7 years until the development of MPTs.19,20 It is apparent that patients at risk may develop secondary tumours long after the presentation of primary tumours, thus supporting the need for long-term follow-up and continuous monitoring after treatment to improve the prognosis of the disease.21
Our study included more males in both MPT and non-MPT groups, with a mean age of 61 years, which is consistent with other reports in the literature.22 However, studies from the Untied States have reported older females to be more affected with MPTs, possibly because the patients groups were smaller.23,24
Our study demonstrated that lower income may play a role in the risk of developing MPTs. A lower income could be linked to greater exposure to risk factors, delayed diagnosis and suboptimal treatment outcomes, potentially leading to a higher incidence of MPTs.
In this study, most MPTs were seen in patients with tongue and tonsil tumours. Moreover, MPTs were predominant in the oral region, involving tongue and floor of the mouth, followed by lungs and digestive system. These findings may support the concept of “field cancerization,” which refers to the presence of genetically and molecularly altered epithelium in the tissues surrounding the primary tumour. 25 The molecular mechanisms of OCC and OPC differ significantly. OCC typically involves carcinogen-induced genetic changes, whereas OPC, especially when linked with HPV, involves inactivation of tumour suppressor proteins including p53 and Rb (retinoblastoma), through expression of viral oncoproteins E6 and E7 respectively. These differences highlight that field cancerization should be considered separately for each site, as the molecular drivers vary. In addition, field cancerization is influenced by environmental, genetic and viral factors that differ across tumour types and tissues.26 Therefore, it is essential to account for these site-specific and tumour-specific factors when considering field cancerization.
Previous studies have reported that smoking and/or drinking alcohol increases the development of MPTs by 25 times or more.27 However, other studies have found little or no relation between smoking or alcohol use and MPT development. For example, Mochizuki et al.21 reported MPTs more frequently in non-smokers, suggesting a genetic or other underlying association. Because of limited information related to smoking and alcohol habits among our patient group, a causal relation could not be established in this study.
In our study, the entire cohort was at an advanced stage of POC, with stage IV the most common at the time of diagnosis. Regression analysis showed that stage was inversely associated with MPT development. This could be because of poor survival of oral cancer patients at an advanced stage of the disease, therefore, not allowing for further tumour development.
This study demonstrated a positive correlation between development of MPTs and existing comorbid conditions, including COPD and diabetes. Various epidemiologic and clinical studies have reported a correlation between increased incidence of oral cancer and diabetes mellitus.28 It has been suggested that long-term exposure to high glucose concentrations causes predisposure to upregulation of oncogenic pathways leading to malignancy.29 Experimental studies on mice also supported the idea that diabetes mellitus facilitated oral tumourigenesis because of various underlying cellular and molecular mechanisms.30 Therefore, oral cancer patients who have an associated comorbid condition must be closely monitored to allow early diagnosis of secondary tumours.
In our study, no significant association was found between the type of treatment received for POC and the development of MPTs. Surgery alone was the most common type of treatment received in the entire cohort, followed by combined chemotherapy and radiotherapy for both non-MPT and MPT patients. These results are consistent with another study showing that surgery alone was carried out in 65% of cases, followed by a chemotherapy plus radiotherapy regime.21 Kramer et al. 31 also reported >50% of patients treated by surgery alone. Although surgery is the most common type of treatment for oral cancer patients, ensuring negative surgical margins does not fully eliminate the risk of development of MPT.32,33 This further supports the concept of field cancerization of oral mucosa, in that even after complete excision of the primary tumour, new MPTs may develop in the condemned mucosa because of genetically altered epithelial cells distant from the surgical site.34
Our study demonstrated that oral cancer patients who had a survival rate >5 years from the diagnosis of POC, showed a sharp decrease in DSS after developing MPTs. Similarly, other studies have also found a significant decrease in survival rate in oral cancer patients who developed MPTs.10,21,35 This could be a result of challenges in diagnosing and treating an additional malignancy because of scar formation from previous surgical treatment of POC.31 Moreover, the histopathologic subtypes of MPTs can significantly influence survival outcomes, as different tumour types exhibit varying biological behaviours, treatment responses and prognoses. MPTs often present as squamous cell carcinomas (the most common subtype) or as malignancies arising from other epithelial origins, such as adenocarcinomas. The identification and classification of these subtypes enable clinicians to stratify patients more accurately, tailoring treatment plans to specific molecular and histologic profiles, ultimately improving survival outcomes.36 Thus, a detailed understanding of histopathologic subtypes is essential for predicting survival and guiding therapeutic decisions regarding MPTs.
Our findings that patients >45 years and BMI <18.5 had an increased risk of death are similar to previous studies.5 However, it is noteworthy that BMI was recorded at the time of initial treatment of POC and not at the time of diagnosis. Furthermore, risk of death associated with synchronous tumours was higher than for metachronous tumours, which is supported by previous studies.37,38 This could be because of presentation of synchronous tumours at a more advanced stage (III or IV) compared with metachronous tumours or because of limited treatment options for additional malignancy.38 Panosetti et al.39 also reported that the prognosis for synchronous tumours worsens if the treatment plan has to be modified because of the occurrence of second primary tumour.
Our study revealed a 3-fold increase in risk of death in MPT patients who had associated comorbid conditions. Previous studies focusing on breast, lung and colorectal cancer reported similar trends.40-42 Suboptimal treatment of cancer patients with comorbidities, along with chances of development of postoperative complications, may be some of the causes of lower survival rates in such patients.43
We also found that the site of an SPT played a significant role in survival. Although the incidence of SPTs was higher in the oral region than in distant sites, survival rate was worse in patients who developed SPTs in lungs and esophagus. Similar results of negative impact on survival rates of oral cancer patients were reported by Chen et al.44 and Dequanter et al.45 These findings suggest that regular screening for lung and esophageal MPTs during the follow up of oral cancer patients might provide a health benefit.
Our findings that higher stage of oral cancer was closely associated with lower DSS are consistent with previous literature.46 Therefore, early detection of a developing tumour is very important to improve the patient’s prognosis.
This study has several limitations. Because it relied on historical patient records, some baseline information was missing that would have been valuable, such as tobacco and alcohol use, which are known to increase the risk of a second primary cancer. Incomplete information about Tumour, Node, Metastasis (TNM) staging also limited our ability to fully understand the differences in clinical profiles and disease outcomes between groups. In addition, the registry database lacks detailed categorization or stratification of comorbid conditions between OCC and OPC patients, which could have provided further insights. Moreover, as the data were extracted from an administrative database, there is a risk of omission or inaccuracies due to human error during data entry.
Despite these limitations, our study, based on a comprehensive provincial database, remains valuable and serves as a foundation for future research on specific morbidities. The breadth of the data provides significant insights into oral cancer trends and offers a starting point for more focused investigations. To build on these findings, future research could benefit from merging multiple databases to gain a deeper understanding of MPT in the context of field cancerization. This approach would enable the inclusion of associated risk factors, such as lifestyle habits and environmental exposures, leading to a more nuanced understanding of MPT development. In addition, incorporating detailed clinical staging in future studies would help clarify the differences between POC and MPT in terms of disease progression and survival outcomes. This would offer a clearer picture of how these conditions vary and impact patient prognosis. Furthermore, expanding the research to a nationwide scale by integrating provincial databases across Canada could provide a more comprehensive view of MPT and oral cancer. Such a study would enhance the generalizability of findings and contribute to the development of national strategies for prevention and management, thereby improving our understanding and approach to these conditions on a broader scale.
Conclusion
The study identified several key risk factors for the development of MPT in oral cancer patients, including being >45 years, having an average income, multiple comorbid conditions and a longer interval between diagnosis and treatment. Conversely, stage IV POC was linked to a lower risk of MPT. Survival analysis revealed that patients with MPT had a shorter mean survival compared with those without MPT, with an overall 5-year DSS rate of 71% for the cohort. MPT patients, particularly those with tumours in the digestive system or with synchronous tumours, had poorer survival rates. Older age, low BMI, multiple comorbid conditions and synchronous MPT were significant predictors of higher mortality, underscoring the need for targeted management strategies for these high-risk individuals. To optimize disease-specific survival and reduce treatment burden and mortality rates, early detection of SPTs is crucial. Patients should be informed about the possibility of secondary tumours at discharge and reassured that early detection and treatment can improve outcomes. Regular monitoring and follow-up appointments are essential, as is close collaboration between primary and secondary health care providers to ensure comprehensive care for these patients.
THE AUTHORS
 |
Dr. Sawani is a master’s student in the Department of Oral Medicine, School of Dentistry, University of Alberta, Edmonton, Alberta, Canada. |
 |
Dr. Ganatra is a clinical professor in the Department of Oral Medicine, School of Dentistry, University of Alberta, Edmonton, Alberta, Canada. |
 |
Dr. Pakseresht is an adjunct professor in nutritional and cancer epidemiology, Department of Human Nutrition, University of Alberta, Edmonton, Alberta, Canada. |
 |
Dr. Amin is a professor and associate chair of research, School of Dentistry; director, graduate program – dentistry; Alberta Dental Association and College Chair in Clinical Dentistry Research, University of Alberta, Edmonton, Alberta, Canada. |
Corresponding author: Dr. Maryam Amin, 5-513 Edmonton Clinic Health Academy, 11405 — 87 Ave NW, Edmonton AB T6G 1C9. maryam.amin@ualberta.ca
Acknowledgements
We thank Dr. Truong Minh Pham for his help and support in gaining access to the Alberta Cancer Registry database. Dr. Maryam Amin is an Alberta Dental Association and College Clinical Dentistry Research Chair.
This article has been peer reviewed.
References
- Sung H, Ferlay J, Siegel RL, Laversanne M, Soerjomataram I, Jemal A, et al. Global cancer statistics 2020: GLOBOCAN estimates of incidence and mortality worldwide for 36 cancers in 185 countries. CA Cancer J Clin. 2021;71(3):209-49. doi: 10.3322/caac.21660
- Canadian cancer statistics 2022: a 2022 special report on cancer prevalence. Toronto: Canadian Cancer Society; 2022. Available: https://cancer.ca/Canadian-Cancer-Statistics-2022-EN
- Ang KK, Sturgis EM. Human papillomavirus as a marker of the natural history and response to therapy of head and neck squamous cell carcinoma. Semin Radiat Oncol 2012;22(2):128-42. doi: 10.1016/j.semradonc.2011.12.004
- Ang KK, Harris J, Wheeler R, Weber R, Rosenthal DI, Nguyen-Tân PF, et al. Human papillomavirus and survival of patients with oropharyngeal cancer. N Engl J Med 2010;363(1):24-35. doi: 10.1056/NEJMoa0912217
- Badri P, Ganatra S, Baracos V, Lai H, Amin MS. Oral cavity and oropharyngeal cancer surveillance and control in Alberta: a scoping review. J Can Dent Assoc. 2021;87:I4. PMID: 34343067
- Glicksman AS, Fulton JP. Metachronous cancer. R I Med J 2013;96(4):41-4. PMID: 23641452
- Zhai C, Cai Y, Lou F, Liu Z, Xie J, Zhou X, et al. Multiple primary malignant tumors — a clinical analysis of 15 321 patients with malignancies at a single center in China. J Cancer 2018;9(16):2795-801. doi: 10.7150/jca.25482
- Howlader N, Noone AM, Krapcho M, Neyman N, Aminou R, Altekruse SF, et al. SEER cancer statistics review, 1975–2009 (vintage 2009 populations). Bethesda Md: National Cancer Institute; 2012. Available: https://seer.cancer.gov/archive/csr/1975_2009_pops09/
- Lubek JE, Clayman L. An update on squamous carcinoma of the oral cavity, oropharynx, and maxillary sinus. Oral Maxillofac Surg Clin North Am. 2012;24(2):307-16. doi: 10.1016/j.coms.2012.01.003
- Ellison LF. Measuring the effect of including multiple cancers in survival analyses using data from the Canadian Cancer Registry. Cancer Epidemiol. 2010;34(5):550-5. doi: 10.1016/j.canep.2010.06.015
- Ellison LF, Bryant H, Lockwood G, Shack L. Conditional survival analysis across cancer sites. Ottawa: Statistics Canada; 2011. Available: https://www150.statcan.gc.ca/n1/pub/82-003-x/2011002/article/11425-eng.pdf
- Fritz A, Percy C, Jack A, Shanmugaratnam K, Sobin L, Parkin DM, et al. International classification of diseases for oncology (3rd ed.). Geneva: World Health Organization; 2013. Available: https://iris.who.int/bitstream/handle/10665/96612/9789241548496_eng.pdf
- Warren S, Gates O. Multiple primary malignant tumors: a survey of the literature and statistical study. Am J Cancer 1932;16:1358-414.
- American Joint Committee on Cancer. AJCC cancer staging manual (7th ed.). New York: Springer; 2010. Available: https://www.facs.org/media/j30havyf/ajcc_7thed_cancer_staging_manual.pdf
- American Joint Committee on Cancer. AJCC cancer staging manual (8th ed.). New York: Springer; 2018.
- Rennemo E, Zätterström U, Boysen M. Outcome of local failures after oral cancer — recurrence vs. second primary. J Oral Pathol Med. 2010;39(9):657-61. doi: 10.1111/j.1600-0714.2010.00905.x
- Ko HH, Cheng SL, Lee JJ, Chen HM, Wang CW, Cheng SJ, et al. Factors influencing the incidence and prognosis of second primary tumors in patients with oral squamous cell carcinoma. Head Neck. 2016;38(10):1459-66. doi: 10.1002/hed.24457
- Lai WM, Chen CC, Lee JH, Chen CJ, Wang JS, Hou YY, et al. Second primary tumors and myeloperoxidase expression in buccal mucosal squamous cell carcinoma. Oral Surg Oral Med Oral Pathol Oral Radiol. 2013;116(4):464-73. doi: 10.1016/j.oooo.2013.06.018
- Feng Z, Xu QS, Qin LZ, Li H, Huang X, Su M, et al. Second primary cancer after index head and neck squamous cell carcinoma in Northern China. Oral Surg, Oral Med Oral Pathol Oral Radiol. 2017;123(1):95-102. doi: 10.1016/j.oooo.2016.08.013
- Rogers SN, Swain A, Carroll C, Lowe D. Incidence, timing, presentation, treatment, and outcomes of second primary head and neck squamous cell carcinoma after oral cancer. Br J Oral Maxillofac Surg. 2019;57(10):1074-80. doi: 10.1016/j.bjoms.2019.09.018
- Mochizuki Y, Harada H, Ikuta M, Shimamoto H, Tomioka H, Tanaka K, et al. Clinical characteristics of multiple primary carcinomas of the oral cavity. Oral Oncol. 2015;51(2):182-9. doi: 10.1016/j.oraloncology.2014.11.013
- Choi SW, Thomson P. Multiple oral cancer development — clinico-pathological features in the Hong Kong population. J Oral Pathol Med. 2020;49(2):145-9. doi: 10.1111/jop.12962
- Qaisi M, Vorrasi J, Lubek J, Ord R. Multiple primary squamous cell carcinomas of the oral cavity. J Oral Maxillofac Surg. 2014;72(8):1511-6. doi: 10.1016/j.joms.2014.03.012
- Wiseman SM, Swede H, Stoler DL, Anderson GR, Rigual NR, Hicks Jr WL, et al. Squamous cell carcinoma of the head and neck in nonsmokers and nondrinkers: an analysis of clinicopathologic characteristics and treatment outcomes. Ann Surg Oncol. 2003;10(5):551-7. doi: 10.1245/aso.2003.09.010
- Jovanoic A, van der Tol IGH, Schulten EAJM, van der Waal I, Kostense PJ, de Vries N, et al. Risk of multiple primary tumors following oral squamous‐cell carcinoma. Int J Cancer. 1994;56(3):320-3. doi: 10.1002/ijc.2910560304
- Xu CC, Biron VL, Puttagunta L, Seikaly H. HPV status and second primary tumours in oropharyngeal squamous cell carcinoma. J Otolaryngol Head Neck Surg. 2013;42(1):36. doi: 10.1186/1916-0216-42-36
- Schantz SP, Spitz MR, Hsu TC. Mutagen sensitivity in patients with head and neck cancers: a biologic marker for risk of multiple primary malignancies. J Natl Cancer Inst. 1990;82(22):1773-5. doi: 10.1093/jnci/82.22.1773
- Giovannucci E, Harlan DM, Archer MC, Bergenstal RM, Gapstur SM, Habel LA, et al. Diabetes and cancer: a consensus report. Diabetes Care. 2010;33(7):1674-85. doi: 10.2337/dc10-0666
- Vander Heiden MG, Cantley LC, Thompson CB. Understanding the Warburg effect: the metabolic requirements of cell proliferation. Science. 2009;324(5930):1029-33. doi: 10.1126/science.1160809
- Vairaktaris E, Spyridonidou S, Goutzanis L, Vylliotis A, Lazaris A, Donta I, et al. Diabetes and oral oncogenesis. Anticancer Res. 2007;27(6b):4185-93. PMID: 18225590
- Kramer FJ, Janssen M, Eckardt A. Second primary tumours in oropharyngeal squamous cell carcinoma. Clin Oral Investig. 2004;8(2):56-62. doi: 10.1007/s00784-003-0246-z
- González-García R, Naval-Gías L, Román-Romero L, Sastre-Pérez J, Rodríguez-Campo FJ. Local recurrences and second primary tumors from squamous cell carcinoma of the oral cavity: a retrospective analytic study of 500 patients. Head Neck. 2009;31(9):1168-80. doi: 10.1002/hed.21088
- Tabor MP, Brakenhoff RH, van Houten VM, Kummer JA, Snel MH, Snijders PJ, et al. Persistence of genetically altered fields in head and neck cancer patients: biological and clinical implications. Clin Cancer Res. 2001;7(6):1523-32. PMID: 11410486
- van Houten VMM, Leemans CR, Kummer JA, Dijkstra J, Kuik DJ, van den Brekel MW, et al. Molecular diagnosis of surgical margins and local recurrence in head and neck cancer patients: a prospective study. Clin Cancer Res. 2004;10(11):3614-20. doi: 10.1158/1078-0432.CCR-03-0631
- Cianfriglia F, Di Gregorio DA, Manieri A. Multiple primary tumours in patients with oral squamous cell carcinoma. Oral Oncol. 1999;35(2):157-63. doi: 10.1016/s1368-8375(98)00105-5
- Liao CT, Kang CJ, Chang JTC, Wang HM, Ng SH, Hsueh C, et al. Survival of second and multiple primary tumors in patients with oral cavity squamous cell carcinoma in the betel quid chewing area. Oral Oncol. 2007;43(8):811-9. doi:10.1016/j.oraloncology.2006.10.003
- Di Martino E, Sellhaus B, Hausmann R, Minkenberg R, Lohmann M, Esthofen MW. Survival in second primary malignancies of patients with head and neck cancer. J Laryngol Otol. 2002;116(10):831-8. doi: 10.1258/00222150260293664
- Bugter O, van Iwaarden DLP, Dronkers EAC, de Herdt MJ, Wieringa MH, Verduijn GM, et al. Survival of patients with head and neck cancer with metachronous multiple primary tumors is surprisingly favorable. Head Neck. 2019;41(6):1648-55. doi: 10.1002/hed.25595
- Panosetti E, Arnold W, Müller W. Site and incidence of multiple cancers in patients with squamous cell carcinomas of the upper aerodigestive tract. Laryngorhinootologie. 1990;69(9):449-53. doi: 10.1055/s-2007-998228
- Cronin-Fenton DP, Nørgaard M, Jacobsen J, Garne JP, Ewertz M, Lash TL, et al. Comorbidity and survival of Danish breast cancer patients from 1995 to 2005. Br J Cancer. 2007;96(9):1462-8. doi: 10.1038/sj.bjc.6603717
- Iversen LH, Nørgaard M, Jacobsen J, Laurberg S, Sørensen HT. The impact of comorbidity on survival of Danish colorectal cancer patients from 1995 to 2006 — a population-based cohort study. Dis Colon Rectum. 2009;52(1):71-8. doi: 10.1007/DCR.0b013e3181974384
- Lüchtenborg M, Jakobsen E, Krasnik M, Linklater KM, Mellemgaard A, Møller H. The effect of comorbidity on stage-specific survival in resected non-small cell lung cancer patients. Eur J Cancer. 2012;48(18):3386-95. doi: 10.1016/j.ejca.2012.06.012
- Søgaard M, Thomsen RW, Bossen KS, Sørensen HT, Nørgaard M. The impact of comorbidity on cancer survival: a review. Clin Epidemiol. 2013;5(Suppl 1):3-29. doi: 10.2147/CLEP.S47150
- Chen MC, Huang WC, Chan CH, Chen PT, Lee KD. Impact of second primary esophageal or lung cancer on survival of patients with head and neck cancer. Oral Oncol. 2010;46(4):249-54. doi: 10.1016/j.oraloncology.2010.01.002
- Dequanter D, Shahla M, Lardinois I, Gilbert O, Hanquet O, Tragas G, et al. Second primary lung malignancy in head and neck cancer patients. Eur Ann Otorhinolaryngol Head Neck Dis. 2011;128(1):11-3. doi: 10.1016/j.anorl.2010.06.004
- Tsou YA, Hua CH, Tseng HC, Lin MH, Tsai MH. Survival study and treatment strategy for second primary malignancies in patients with head and neck squamous cell carcinoma and nasopharyngeal carcinoma. Acta Oto-Laryngologica. 2007;127(6):651-7. doi: 10.1080/00016480600951517